


Imagine you were tasked with building an industrial application. This application needs to store measured values from sensors on an assembly floor. Because of strict quality control regulations, you also need to record the data that these sensors collect with time as a key index, so that historical values can be analyzed.
As your sensors record new stimuli in the real world, you need to be able to continuously add data by appending a new entry (row) to the end of your table. This heavily write-intensive functionality is needed to track the state of your system - or the variables you decide to track - over time.
You considered using relational databases, e.g. PostgreSQL, but ran into some limitations:
-
Time series data grows quickly, with heavy write loads. Scaling Postgres to fit the load is far from optimal because your ingestion and query performance will degrade massively as you scale — the [TimescaleDB] extension will alleviate some of those issues, but you'll still eventually run into scalability issues due to PostgreSQL’s source / replica model.
-
You need a database with functions tailor-made for managing time series data. For example time functions and ranges, granularities (with which to cluster query results), aggregations (to summarize data from a range), and contextual information for managing how queries are run, batched and timed-out on the sort of massive data sets that you now own and control.
With these requirements in mind, you’ve made the case for a time series database (TSDB). In this piece, we'll briefly explain what a TSDB is and identify its most suitable use cases before diving deeply into M3, the distributed time series database, aggregator, and query engine.
We’ll look at what it is, what it does, how it does it, go through some of its key features, and examine the power of M3’s approach. But first, let’s look at the time series database.
What is a time series database?
A time series database is designed to store data as pairs of time(s) and value(s). At its most elementary level, a TSDB pairs timestamps and data points — this provides the precise time the data was recorded.
A TSDB can have multiple time series, with each series consisting of a metric and one or more tags that uniquely identify the metric. A metric can be any specific piece of data that you want to track over time.
Two common use cases for TSDBs are temperature and stock price monitoring. A time series database provides context for each data point in relation to the others in a continuous flow of data. The time data attached to events like temperature readings or stock prices can be cross-referenced to external events that may have influenced the values.
For example, a malfunctioning ventilation system may be the root cause of your manufacturing facility’s temperature rising above the upper threshold. Alternatively, a sharp rise in a company’s stock price could coincide with a successful IPO.
Storing time data may not be necessary for databases that store records about unchanging objects, but for monitoring physical or virtual environments with constantly changing parameters, time is an essential variable.
Another use case is IoT, whose rise in adoption has in part been enabled by new technologies such as TSDBs. However, the number of use cases abound where collecting and tracking data over time is beneficial:
-
Monitoring CPUs, virtual machines, memory, and software systems;
-
Monitoring physical devices, sensor input, actuator input, and response;
-
Business intelligence: tracking key metrics and system/organizational health;
-
Monitoring vital/health statistics: tracking the state of the body;
-
Asset tracking: fleets, equipment, containers, human resources;
-
Energy consumption trends;
-
User/customer interaction data;
-
Logistics and shipping data.
Now that we know what a time series database is, what makes it uniquely capable to handle time series data, and the kind of use cases it's purpose-built for, we’re ready to check out M3.
The history of M3DB
In the past, as time series applications took in massive amounts of data, some of the original single-node, single-threaded solutions began to come up short, right along with the non-distributed nature of their databases.
Uber’s version of this story involved Graphite, which served as their main metrics store. However, Graphite’s poor resilience and lack of replication functionality inevitably led to data loss, and Uber quickly moved away from it as their platform’s needs grew.
Uber devised plans for a new platform with fault-tolerant metrics ingestion, storage, and queriability, serving five specific goals:
1. Improved reliability and scalability: to avoid worrying over availability loss or accuracy deterioration.
2. Cross-data center query results: to globally and holistically monitor and control services and infrastructure.
3. Low latency SLA (service level agreement): to ensure dashboards and alert query latency remain interactive, responsive, and reliable.
4. First-class dimensional “tagged” metrics: for the flexible, tagged data model that Prometheus is already known for.
5. Backward compatibility: to guarantee that legacy services emitting StatsD and Graphite metrics maintain functionality without interruption.
To accomplish their goals, Uber realized that they would need to build a solution from scratch and with that, M3 was born. Initially intended to be a distributed Prometheus sidecar, M3 was developed further to overcome Prometheus’s single-node scalability and durability limits, while enabling essential backward compatibility, effectively rendering the company’s once static Prometheus resources now scalable and configurable multi-tenant.
To that end, M3 included a Prometheus-compatible query engine and supporting framework that could instantly access and store Uber’s billions of back-end metrics. M3 was open sourced in 2018 so that the broader development community could benefit from its robust functionality — similar to what SoundCloud did with Prometheus in 2012.
What is M3 and M3DB?
M3 is a globally scalable, highly available, open-source distributed metrics platform. Along with horizontal scalability, M3 possesses excellent data compression, resolution (aggregation), and geo-distribution capabilities.
Let’s clear up a bit of confusion — M3 is not just a database. It’s actually a platform that includes a native, distributed time series database (M3DB), an aggregation service, a query engine, and other supporting infrastructure.
M3 has multiple components, but here are the most important ones:
-
M3DB: the core storage service. A distributed-by-node time series database. Built in Go, it comes with extensible, scalable storage, and reverse-index time series.
-
M3 Aggregator: a metrics-aggregator service, providing stream-based downsampling. Data can be aggregated based on predefined criteria.
-
M3 Coordinator: a service coordinating reads and writes between systems and maintaining cluster consensus that can accept multiple formats (e.g. Prometheus, collectd, fluentd, and many more).
M3 integrates out of the box with Prometheus, Graphite, and Grafana for metrics and data visualization. So what exactly can M3 do?
What can M3DB do?
Simply put, M3 as a whole provides the capability to manage multi-dimensional time series data scalably and durably, and to act as the backbone for unlimited metrics capabilities.
Here’s an example of raw time series data being produced by a service. Our measurement unit for the timestamp is in nanoseconds (ns):
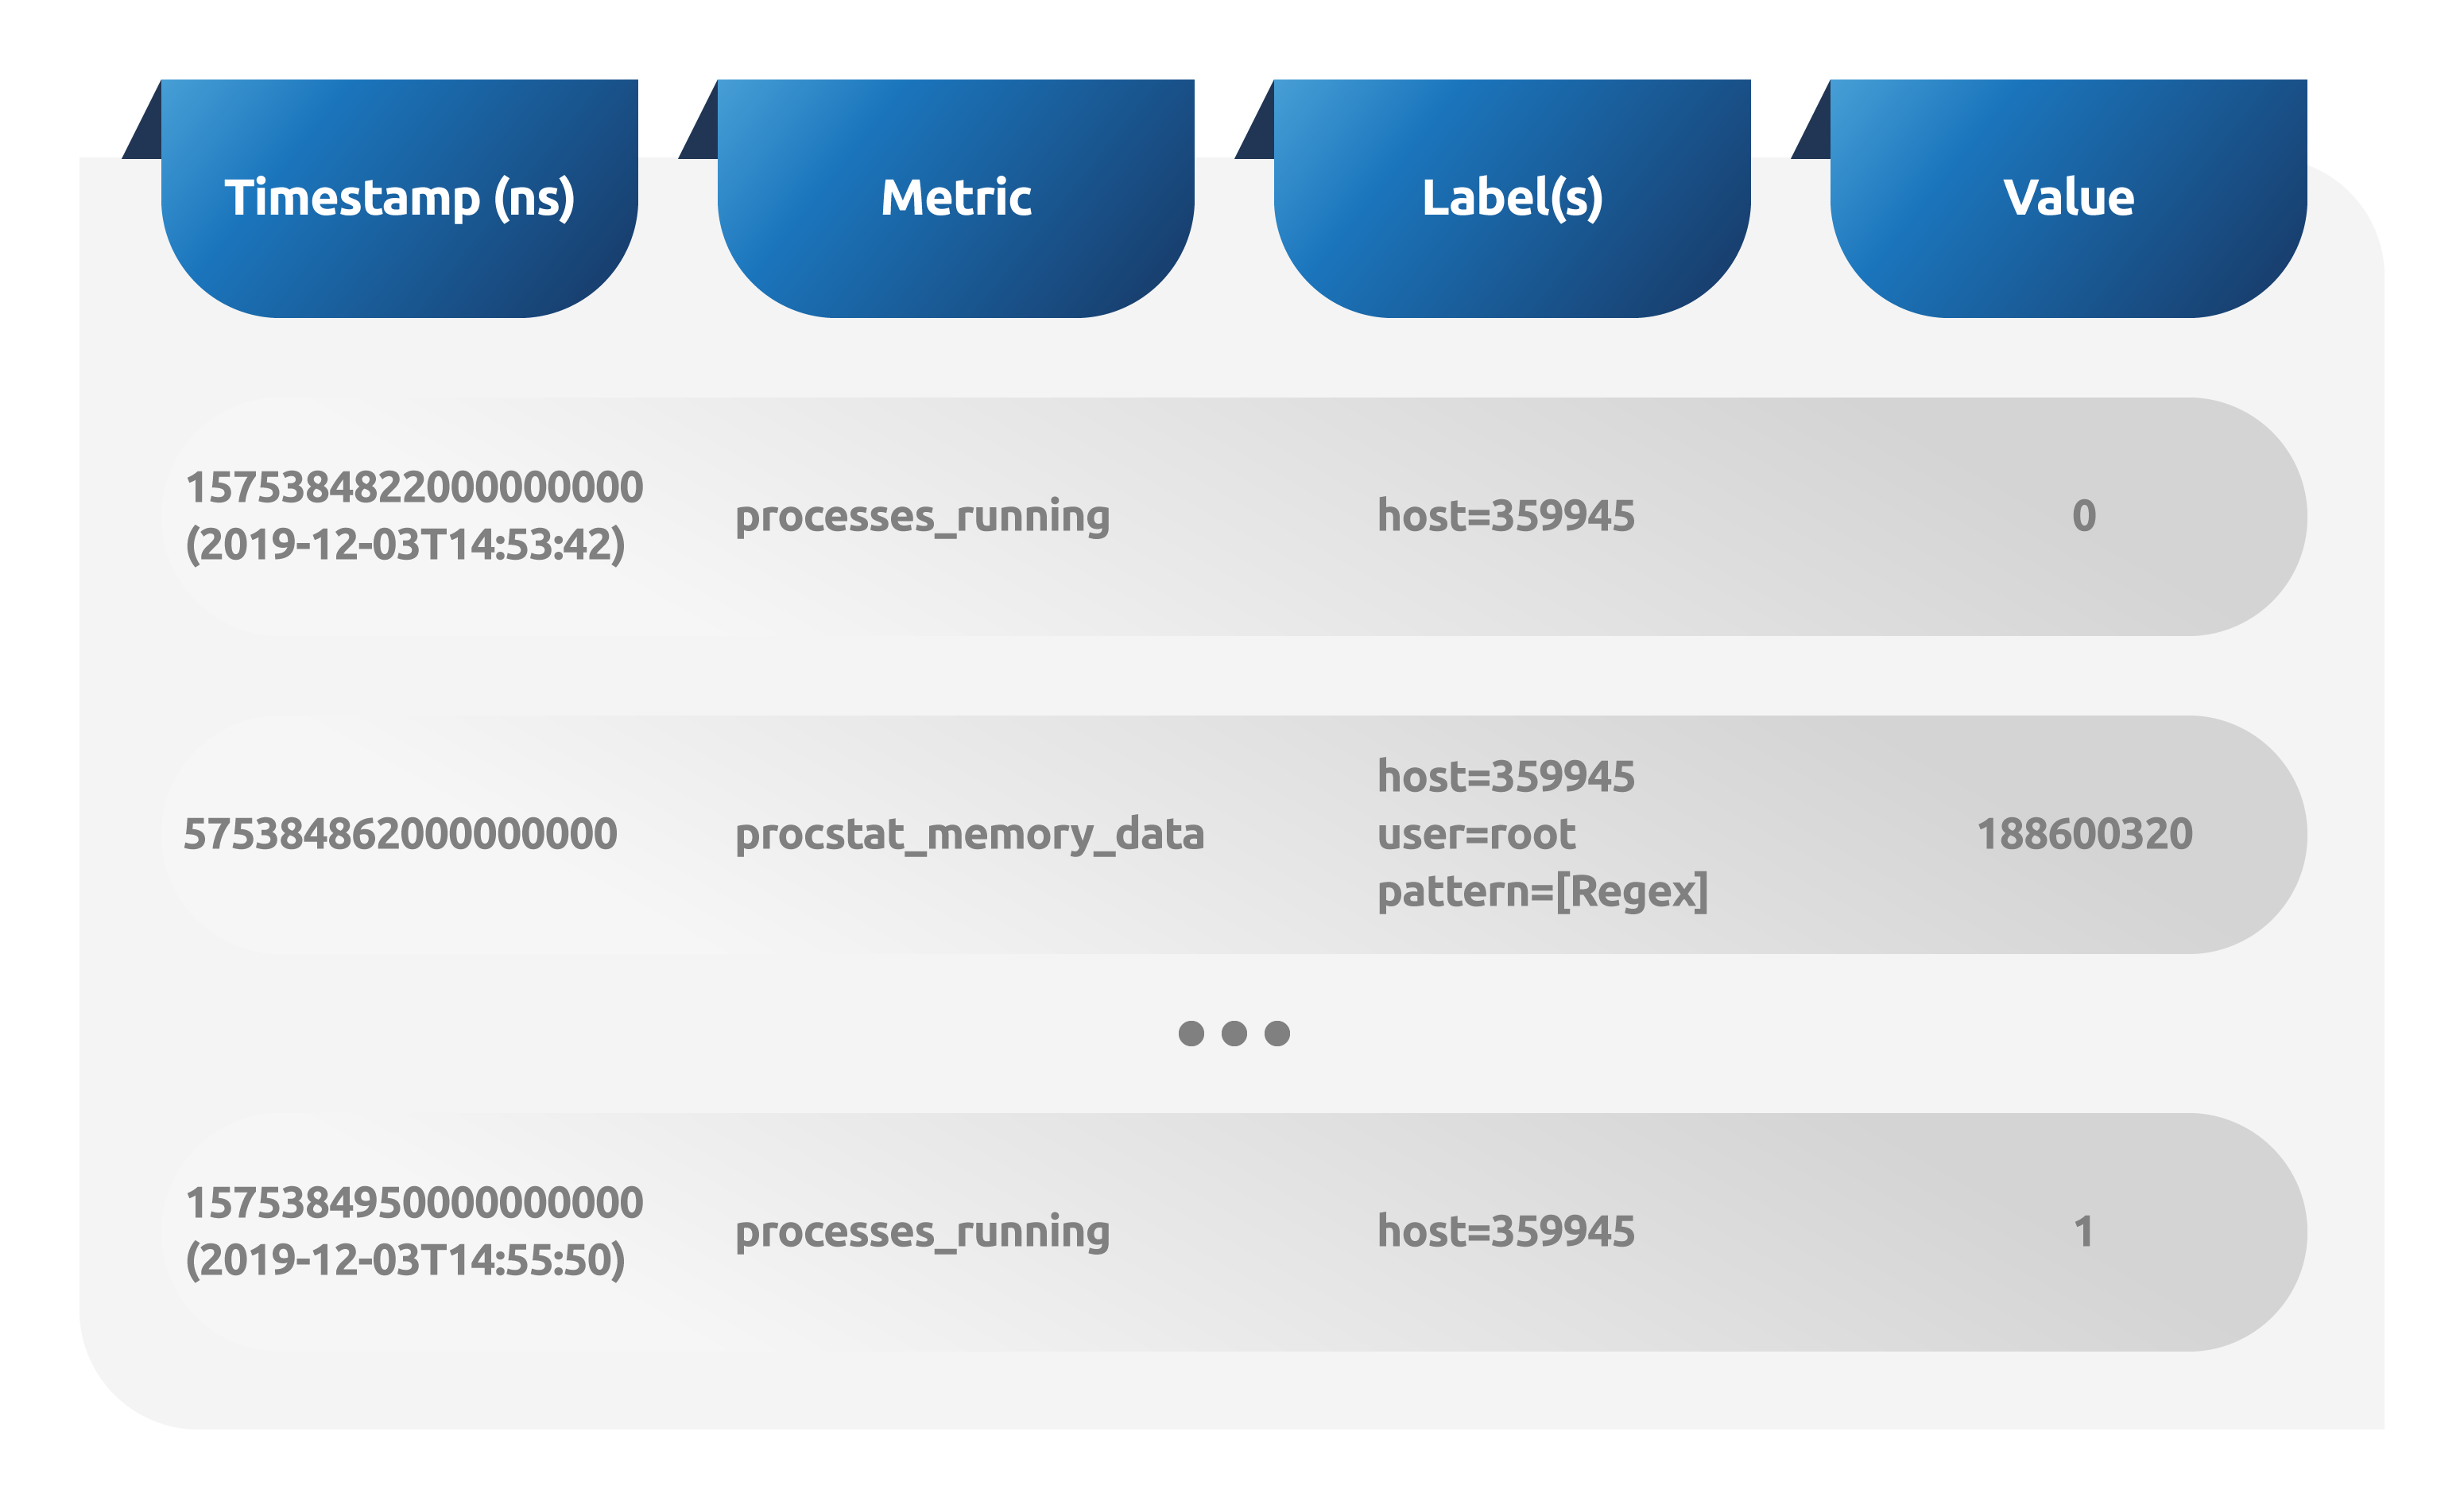
When indexing by timestamp, there are aggregations and other functions for time series data that are perhaps not found as easily (nor used as efficiently) in relational databases. Time series data, which are appended as records to the end of the table (namespace in M3 parlance) as new data are written, may typically contain a timestamp, some metric, label and value. Time series databases, like M3DB, are designed to make the best use of this data.
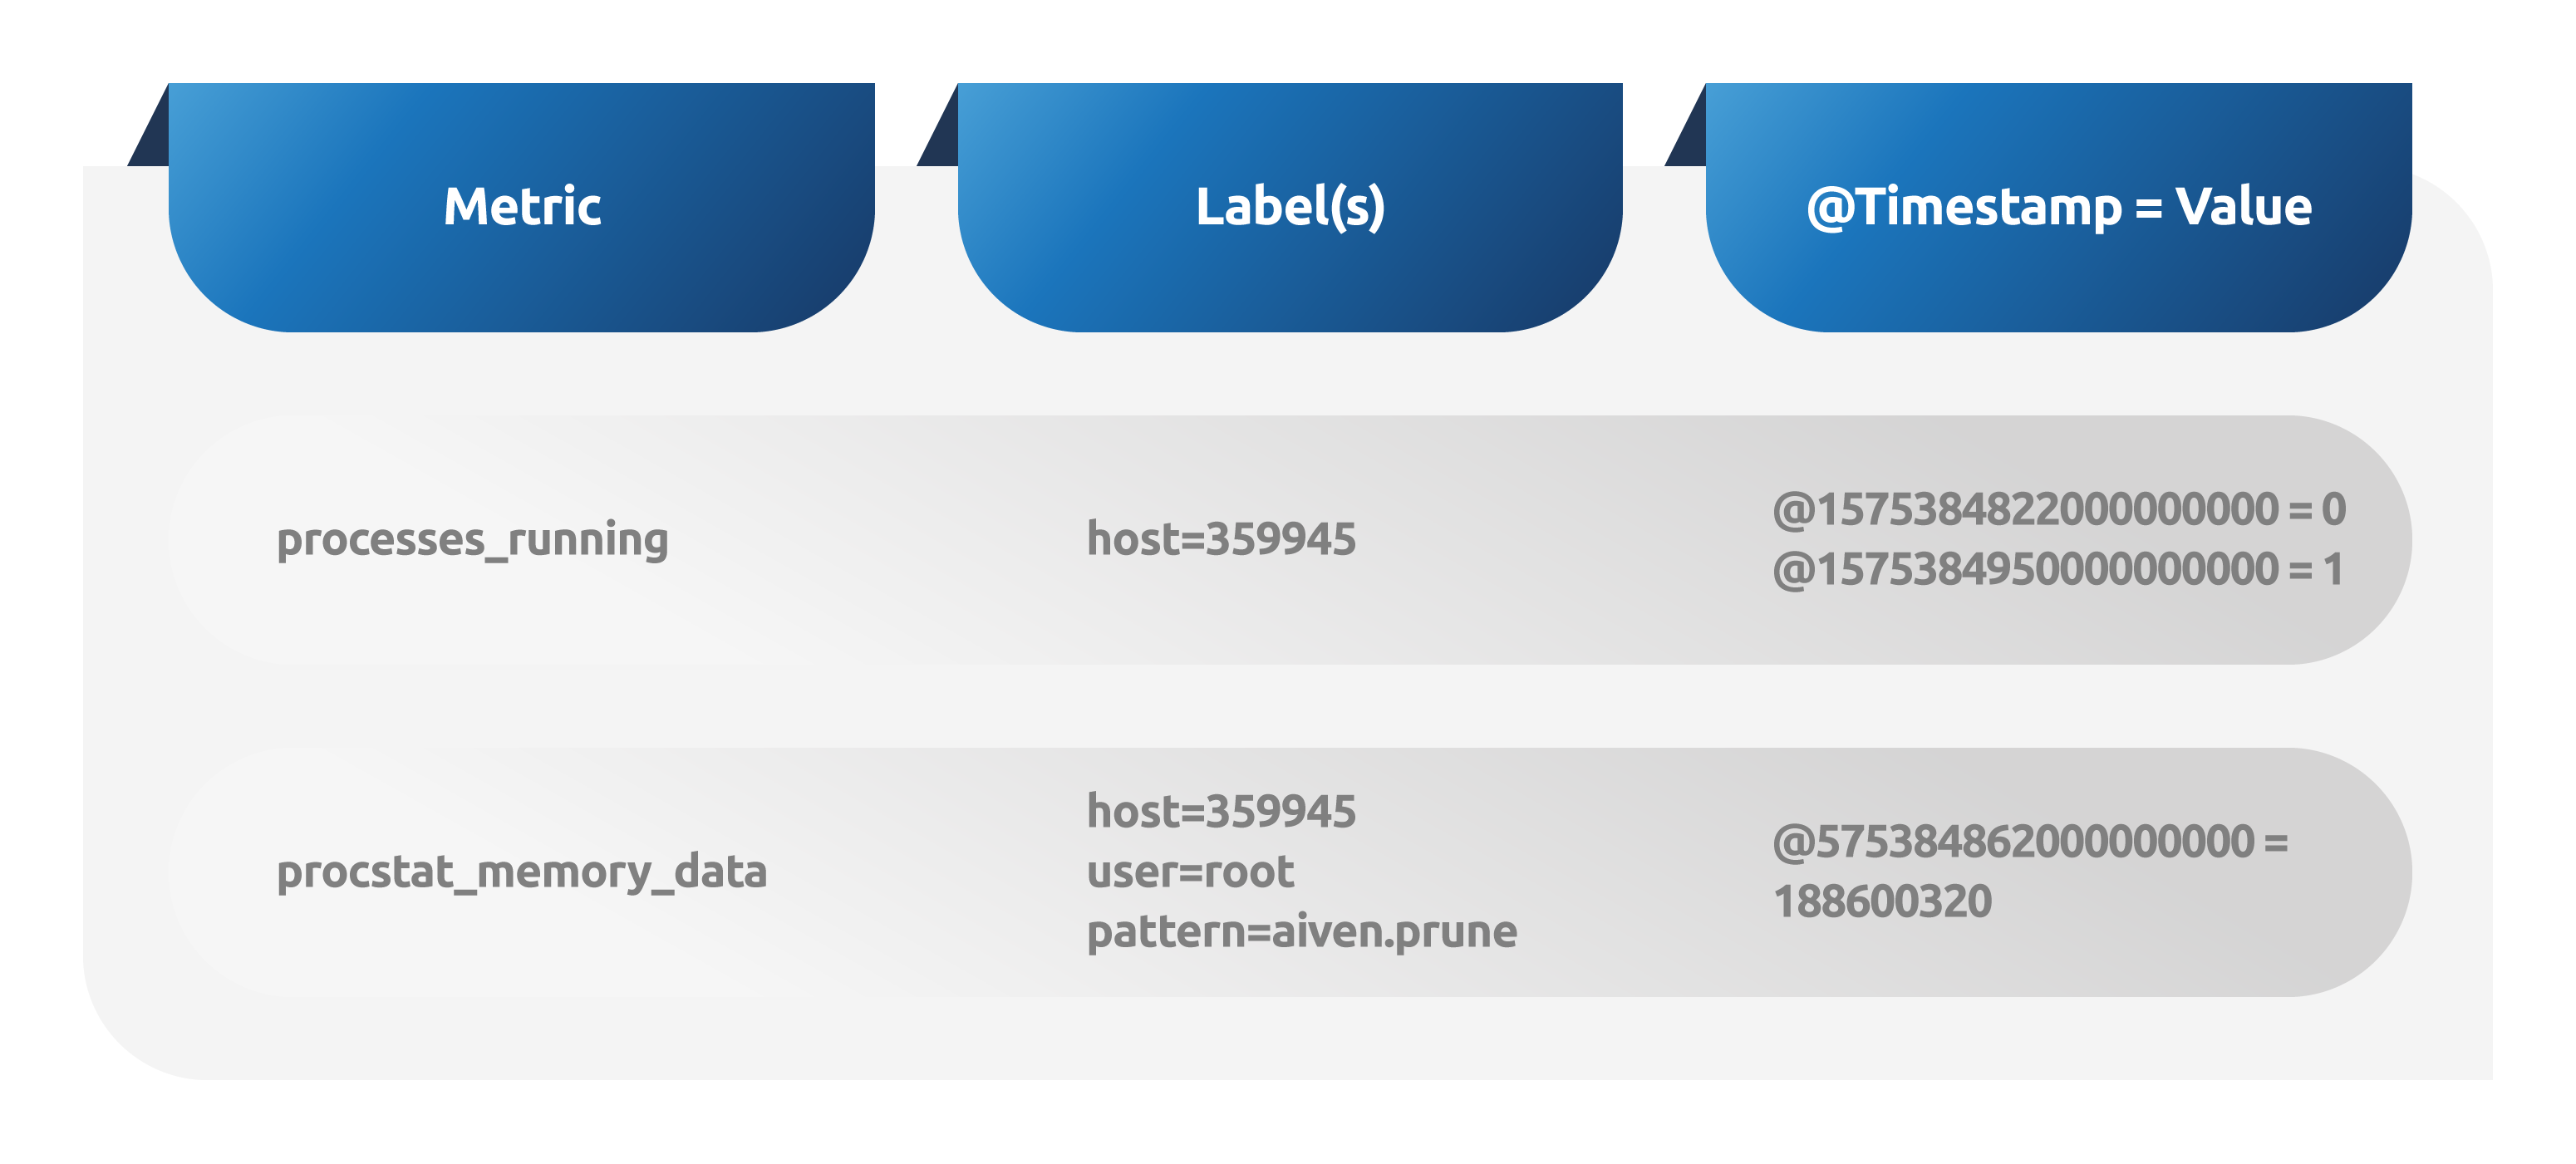
And this is how the above data may be stored in M3DB — in this case, timestamped events are being aggregated by metric.
The M3DB data model
To support the aggregation of time series data, M3 employs a few data modeling concepts, hierarchically:
-
Database: Single instance always. This is the highest level in the data model.
-
Namespace(s): (inside Database)
- Analogous to a table
- Time-limited (months’, weeks’, days’ worth of data, for example)
- Unaggregated or aggregated (at fixed intervals)
- Queries will use the namespace(s) that best fit them.
-
Shard(s): (inside Namespace)
- Contains arbitrary series
- Sharded by ID
- Shards are replicated to a number of nodes based on the replication factor
-
(Time) series: (inside Shard)
- Buffer: Recent data collected in memory (and in write-ahead log never used for reads)
- Blocks: Immutable data persisted to disk as filesets (per Shard).
Uber uses this data architecture and model to process tens of trillions of metrics per day, and upwards of hundreds of millions per second with ~20 million aggregated metrics available at any given time. This is way beyond the capabilities of other time series databases or set ups.
To find out how M3 can process data at this scale, let’s look at how it works.
How does M3 work?
M3DB’s storage engine can be best understood “...via the boundary between its in-memory object layout and on-disk representation.” That is to say, memory use plays at least as significant a role in M3’s throughput and performance as does its disk writing mechanism.
However, M3DB as a storage layer is just one piece of the M3 architecture. To optimize performance, there are several different node types, provided as discrete components, each with different functions:
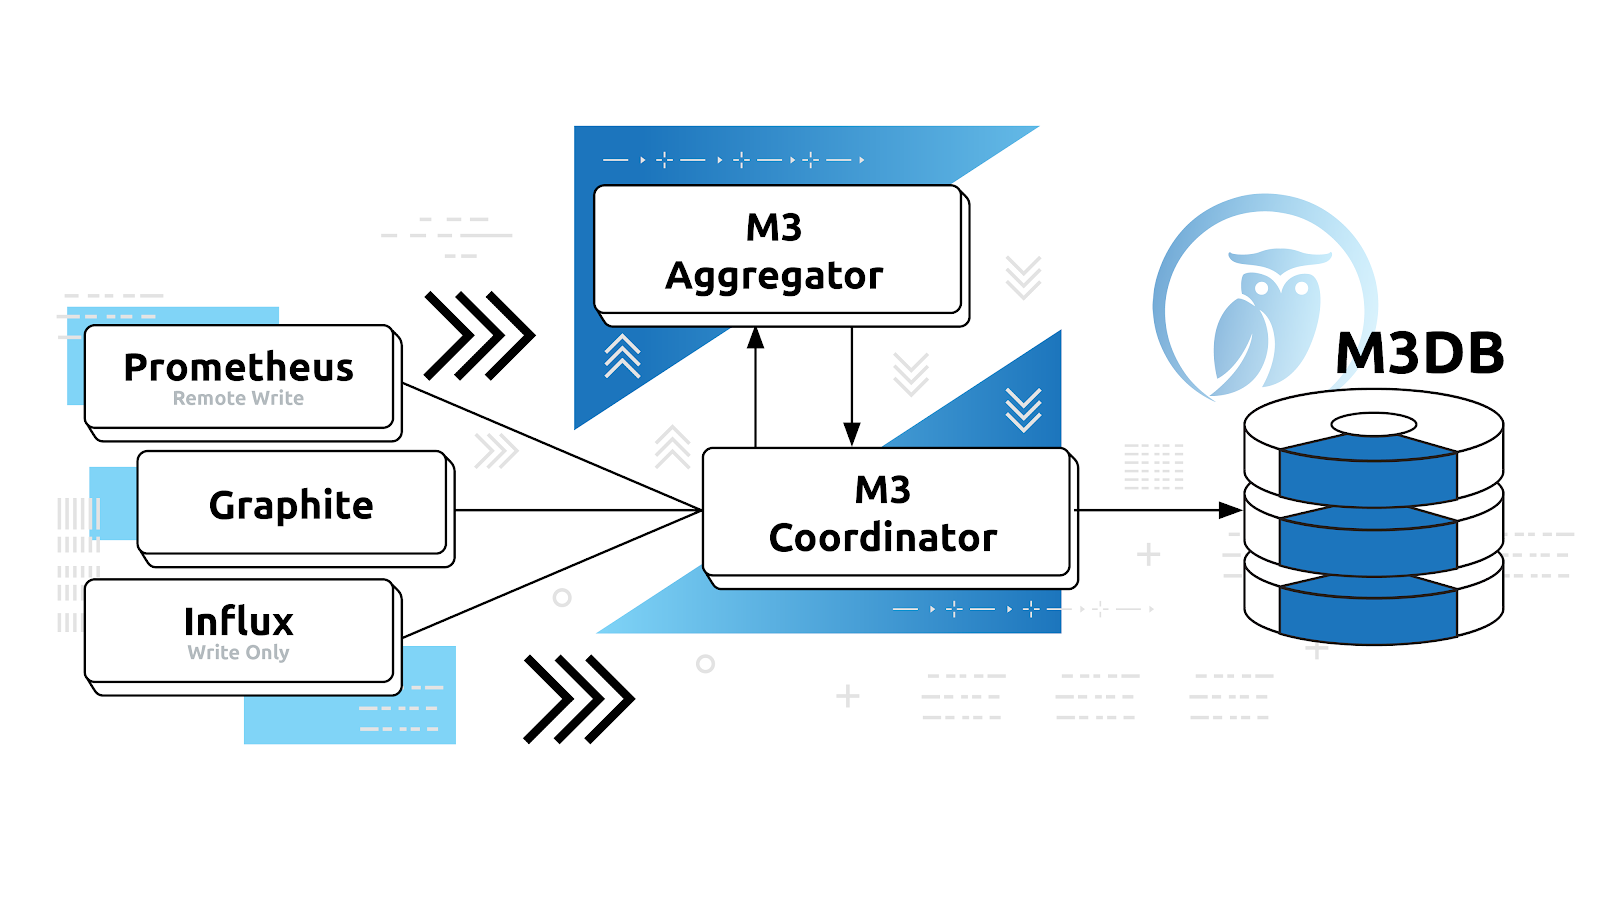
Now, let’s take a closer look at the main components that make up the M3 platform.
Components of M3
M3 Coordinator
M3 Coordinator is responsible for reads and writes from upstream systems, such as Prometheus, Carbon, InfluxDB, etc to M3DB. It serves as a primary interface to REST API as a sidecar process for Prometheus that allows M3DB to act as a long-term data store.
M3 Coordinator supports both data ingestion (writes to database) and queries (reads from database) with two subsets of itself:
- m3query: a read-only version
- m3ingest: a write-only version
M3 documentation describes Coordinator as “...a bridge that users can deploy to access the benefits of M3DB such as long-term storage and multi-DC setup with other monitoring systems, such as Prometheus.”
Coordinator gets your data where it needs to be. To get data into long-term storage, you need to decide the granularity with which the data can be displayed in analytics. This is where M3 Aggregator comes into play.
M3 Aggregator
M3 Aggregator handles metrics aggregation over time. Based on dynamic rules stored in etcd, it provides stream-based downsampling — decreasing the granularity of your time series data and making it more applicable for analytics functions.
M3 Aggregator runs as a dedicated downsampler, which allows metrics to be stored at different resolutions. While some of M3 Aggregator’s features are found in M3 Coordinator, a dedicated aggregation function that is sharded — as is the case in M3 Aggregator — requires less care to deploy and run in high availability.
M3 Aggregator communicates using m3msg, a pub-sub mechanism. As a partitioned message queuing, routing, and delivery library, it facilitates high-speed message transmission without the need for disk durability.
M3DB
M3DB is where actual data storage takes place. It provides a reverse index and does not have a public API. Instead, it uses an Apache-Thrift based RPC mechanism as its main communication method.
M3DB uses a shard design similar to Apache Cassandra’s in that the shard ID is derived by adding the metric’s murmur3 hash to its labels; by default, shards are assigned from a pool of 4096 virtual shards.
These shards are mapped to real nodes based on the replication factor (the configured number of nodes to which a shard is to be replicated). The number of shards created is immutable after cluster creation.
M3DB leverages memory, but the actual on-disk storage consists of write-ahead logs (WALs) to represent blocks in memory, and immutable filesets containing the data. The primary unit of long-term storage for M3DB are called filesets. A fileset includes the following file types:
-
Info file: Stores metadata about the fileset volume as well as the block time start and size.
-
Summaries file: Stores a part of the index file to keep the contents in memory and allows for fast indexing with linear scanning.
-
Index file: Stores series metadata, including tags for indexing purposes, and the location of the compressed stream for retrieval purposes.
-
Data file: Stores the series compressed data streams.
-
Bloom filter file: Stores a bloom filter bitset for all series contained in the filesets.
-
Digests file: Stores the digest checksums of the info file, summaries file, index file, data file, and bloom filter for integrity verification.
-
Checkpoint file: Stores a digest of the digests file for the purpose of quickly checking if a volume was completed.
Filesets are flushed to the disk once new entries are no longer expected for a particular block, so filesets represent older data, in a sense.
All M3 components are written entirely in Go programming language. M3Query, a distributed query engine supporting PromQL and Graphite, with M3QL query language is coming soon, therefore PromQL query language serves as a stand-in for the time being.
A note on query languages, including PromQL
M3QL via M3Query is currently under development, but for now, it’s possible to query M3 via REST API using PromQL and Graphite. In fact, M3 is already used by many as an extension of Prometheus’s storage capabilities, and as providing a backward-compatible antidote to Graphite’s scaling limitations.
The power of M3 in summary
M3 is fully open source, with a top-notch developer community and development process. M3 is horizontally scalable via its architecture but consists of components that can easily be co-located or distributed. The M3 platform offers a wide range of features and tooling and is the best all-in-one platform for processing time-series data.
These features include:
-
Cluster management: Out-of-the-box support for multiple clusters, using etcd;
-
Built-in replication: Configurable durability for your needs;
-
Customizable consistency: Quorum, higher or lower based on your durability SLA;
-
High compression: Inspired by Facebook’s Gorilla TSZ compression, configurable as lossless or lossy;
-
Arbitrary Time Precision: Available from seconds to nanoseconds; you can also switch precision with any write;
-
Out-of-order writes: Handled seamlessly, at least until the block is flushed to the fileset (typically currently writes are time-limited to hours); cold writes to flushed filesets are under development
-
Seamless compatibility: With Prometheus, Graphite, and InfluxDB to name a few.
Aiven for M3
M3 and M3 Aggregator, are currently available as managed services. Why is this important? Aside from the exponential increase in time series workloads over the past few years, it is the first managed open-source, distributed time series database, thereby unlocking the potential of the use case.
As with other Aiven services, you don’t need to worry about configuration, management, deployment, or updates with a managed M3 service. You will also have access to a full suite of integrations and industry-leading tooling to ensure cluster reliability and scalability.
M3 has some excellent performance upsides for a managed service. These include a lean memory footprint to avoid bottlenecks, out-of-the box support for multiple clusters, metrics-pipeline optimizations, and as mentioned before, Gorilla TSZ-based compression — try it out for yourself.
Wrapping up
In this article, we provided a high-level overview of time series data and why TSDBs are needed and looked at M3 in detail: what it is, what it does, how it does it, went through some of the features, and examined the power of M3’s approach.
And lastly, we discussed why we’re offering it as a managed service. Stay tuned and follow our blog to remain up-to-date. You can also follow our changelog RSS feed, or follow us on Twitter or LinkedIn.
Further reading
If you're thinking about plugging M3 into Grafana, have a look at Lorna Mitchell's post Metrics and graphs with M3 and Grafana