

What happens if you have an interesting data set, a lot of ideas and questions, and the clock is ticking? You want to deliver quality insights within minutes and make innovation simple, and we want to help with that. Our demo - using the Digitransit data set, with tools and open source services from the Aiven Platform - shows an example of how it can work.
We also hosted a webinar where Dave explained this topic in more detail. Watch the recording here:
What we’ll cover:
- The Digitransit platform: check out the data architecture components for our solution and the input data source from the 3rd party API.
- Digging into the underground: take a look at our tube map as we get started on our journey!
- First leg: visit the Kafka Connect® framework for subscribing to the MQTT feed.
- A stopover at Apache Flink: for a spot of mapping, flattening and some transformations
- Last stop: to get your data safe and sound so you can run your analytical queries.
- Wrapping up: try this out yourself with some extra credits. Take the Catch the Bus Challenge on the Aiven Console, and take a look at some of our other resources.
From open source platform to railway platform: the basis of our demo
Digitransit powers the websites and mobile apps used by Finnish travelers every day. What’s special about this platform (and why we like it here at Aiven) is that it’s fully open source. They provide a lovely set of APIs for mapping, geocoding and some near-real-time data feeds for service alerting, trip updates and vehicle positions.
Let’s grab this data feed, build a pipeline quickly on Aiven, and use these events to learn something new about the state of public transport in Finland!
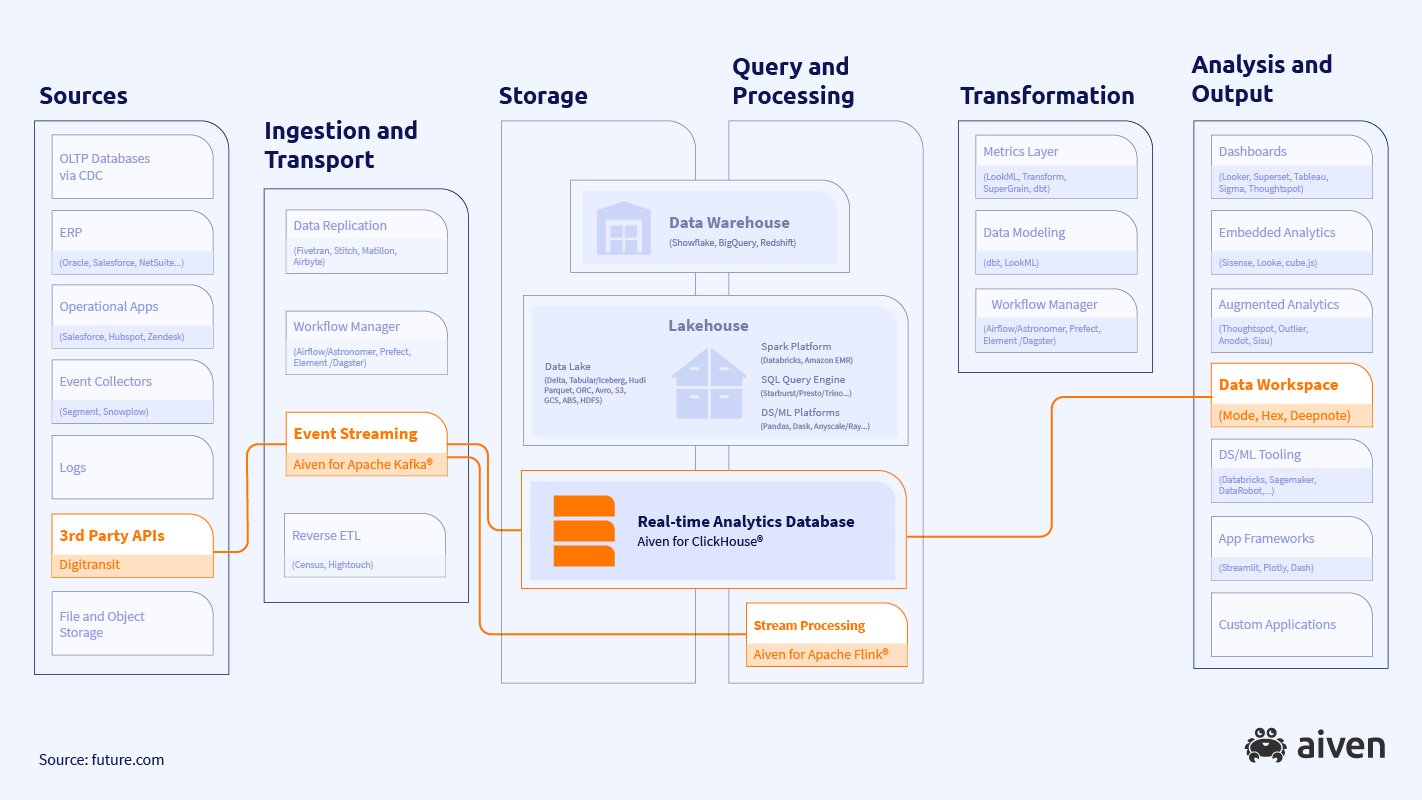
As you can see, data pipeline architectures can get complex (and if you’re interested in diving deeper, take a look at future.com’s great info). But here above, we’ve highlighted the data pipeline architecture components we’ll use for our solution:
- The input data source is the 3rd party API provided by Digitransit, which sends the data as an MQTT stream.
- We’ll use an event streaming platform powered by Apache Kafka®.
- Stream processing works through Apache Flink®.
- Our real-time analytical database is powered by ClickHouse®.
And all of these are running on Aiven!
Digging into the underground
Here’s the full map of what we’re set to build.
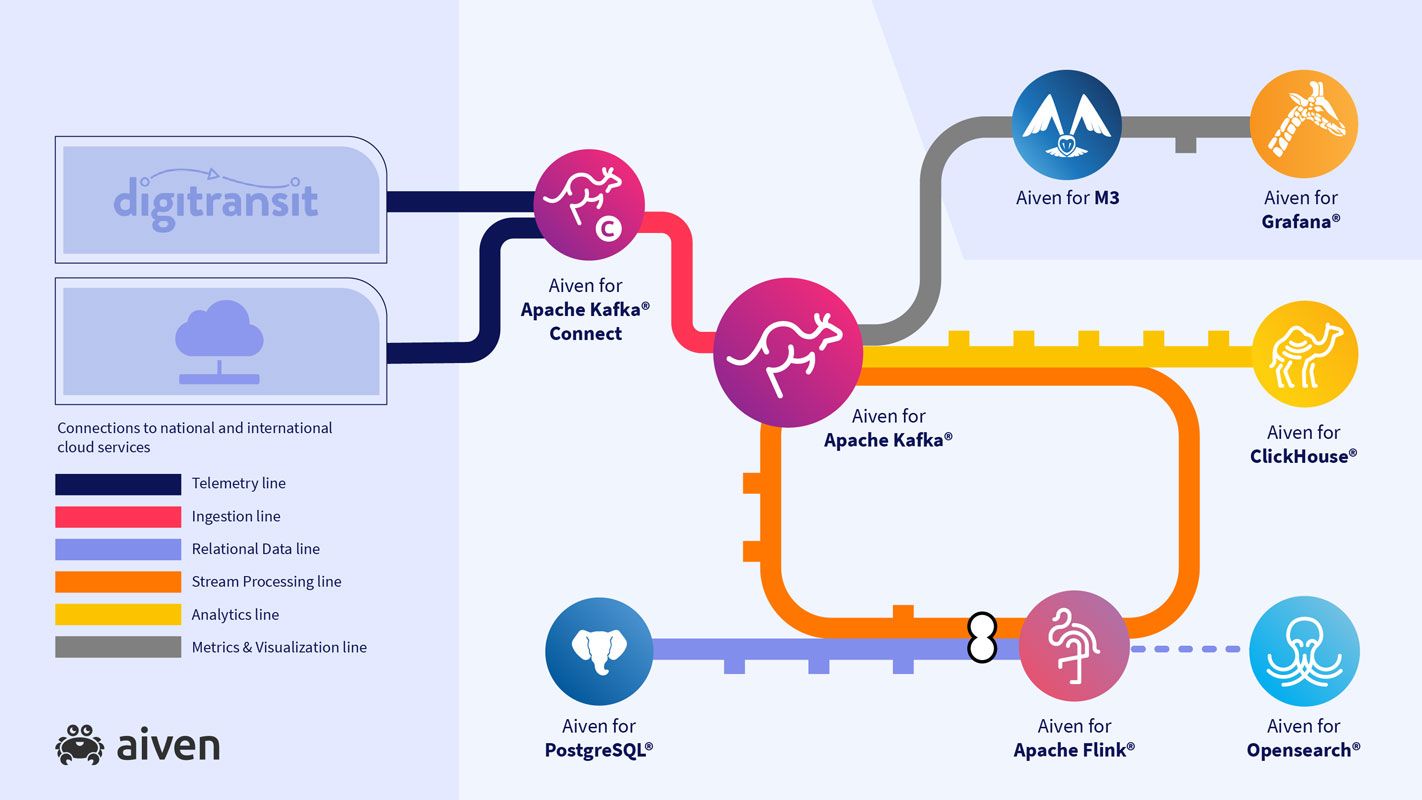
Outside of the core services already mentioned, you can see we have a few extra stops along the way:
- The Kafka Connect® framework for subscribing to the Digitransit MQTT feed
- M3DB as a time series database along the top
- A Grafana® instance for dashboards
M3DB and Grafana are used to monitor the state of the pipeline and make sure it's healthy. We can check out incoming message rates and consumer lag, and set alerting thresholds for them.
With your trial account, drop into the Aiven console where you’ll see the full range of open source managed services on offer.
Minor configuration on the Kafka Connect® line
Inside our Kafka Connect® service we’ll run the MQTT Source Connector from Stream Reactor. There’s no custom coding required, just some minimal configuration to point to the correct endpoint, pass in the topic details and let the connector know what data format to write (we’re going with JSON just to keep it simple, but Avro’s also an option).
Once this is running, we get records like this appearing on a Kafka topic.
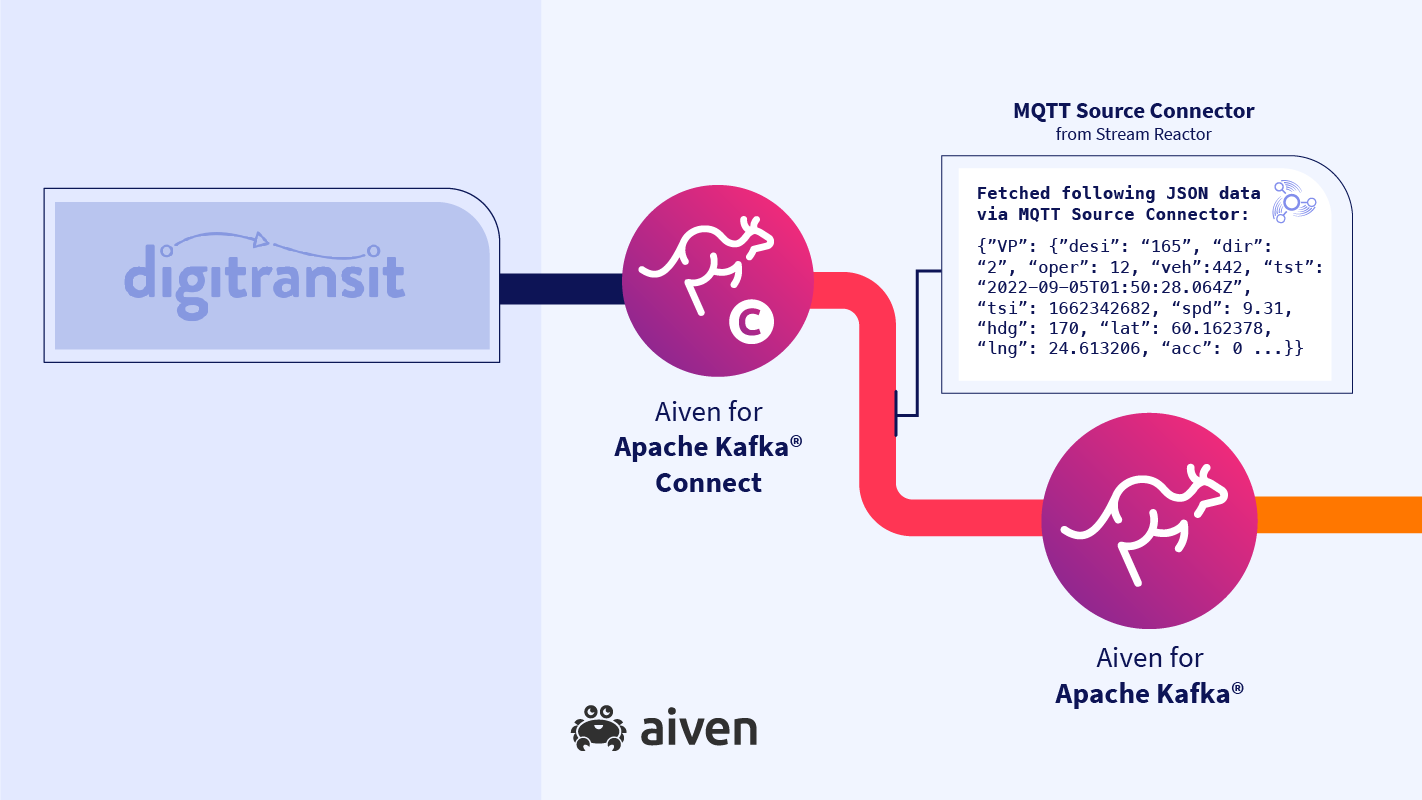
We have operator IDs, vehicle IDs, speed, heading, location as latitude / longitude and a variety of other fields. But there’s a couple of problems here.
First, the whole thing is wrapped as a JSON object called VP (vehicle position). Second, these IDs don’t mean much - we want to know the transport operator’s name.
Note: If you want to see how to build all this in Github using Terraform, we’ve got you covered.
A stopover at Apache Flink for pre-processing
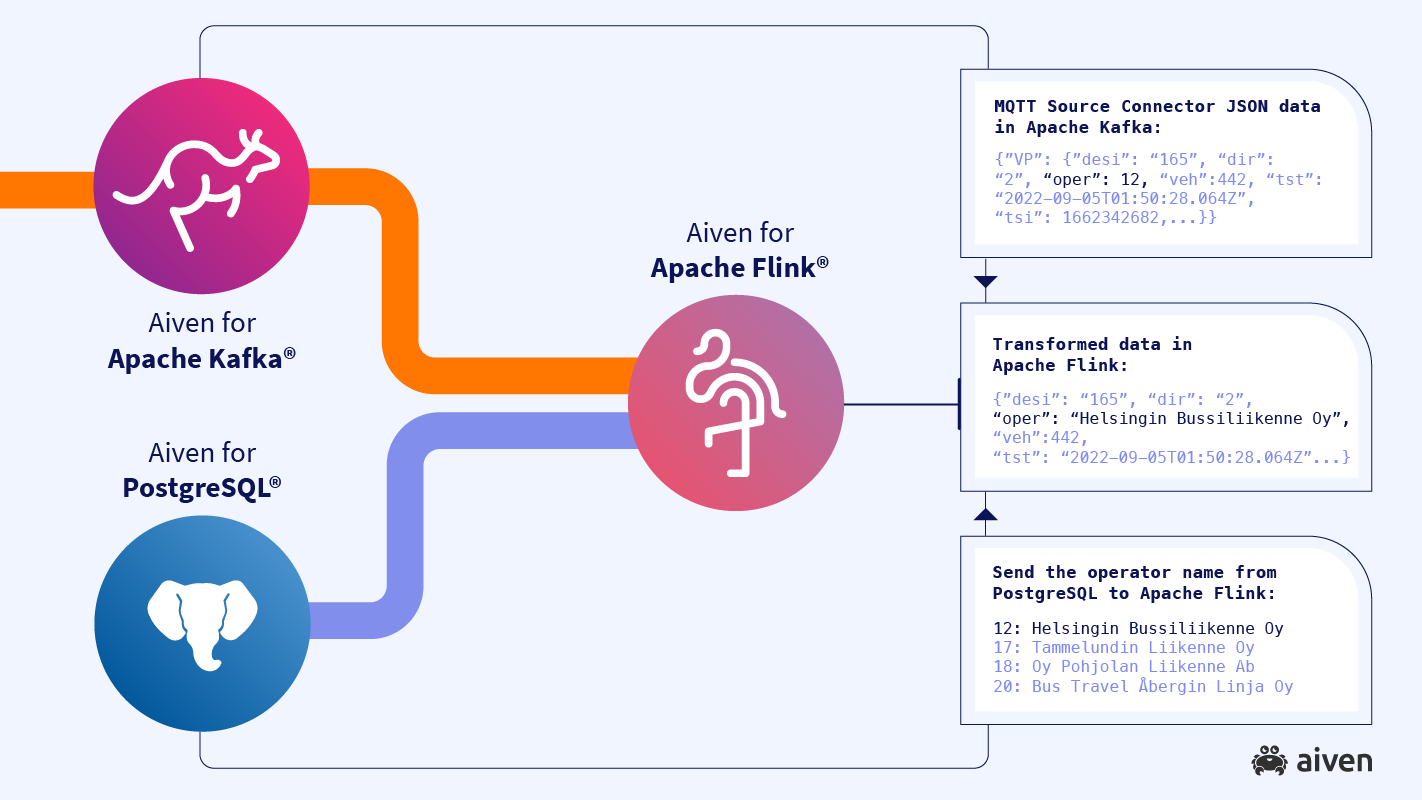
So let’s pass through Apache Flink to pre-process the stream. We’re doing a few things here:
- We’ll join each record to a small reference dataset that’s sitting in a PostgreSQL database, just a simple mapping of operator ID to name.
- We’ll get rid of that nesting and write a flattened set of values to a different topic, still in JSON format but without that useless wrapper object.
- We could also do some simple transformations. For example, the speed value is reported in meters per second but maybe I’d prefer miles per hour or kilometers per hour. Here would be a great place to write a new computed column alongside the original.
These transformations are defined as an SQL query. We define Flink tables which act as overlays on top of both the raw data Kafka topic and reference data table in Postgres, select from these and join however we like, then write back to a new table which sits on top of a second Kafka topic for pre-processed records.
Last stop: Aiven for ClickHouse
Finally, we want our data in Aiven for ClickHouse so we can run analytical queries against it very soon after it arrives. ClickHouse has great Kafka integration out of the box so we can define a table here with an engine type of Kafka, which runs a consumer group and constantly reads new data arriving on the topics we want.
Querying this table shows us the latest records consumed, so it’s no good on its own - you can’t query the same data twice without resetting the consumer group details. So what we’ll do instead is create a ClickHouse materialized view on top of it.
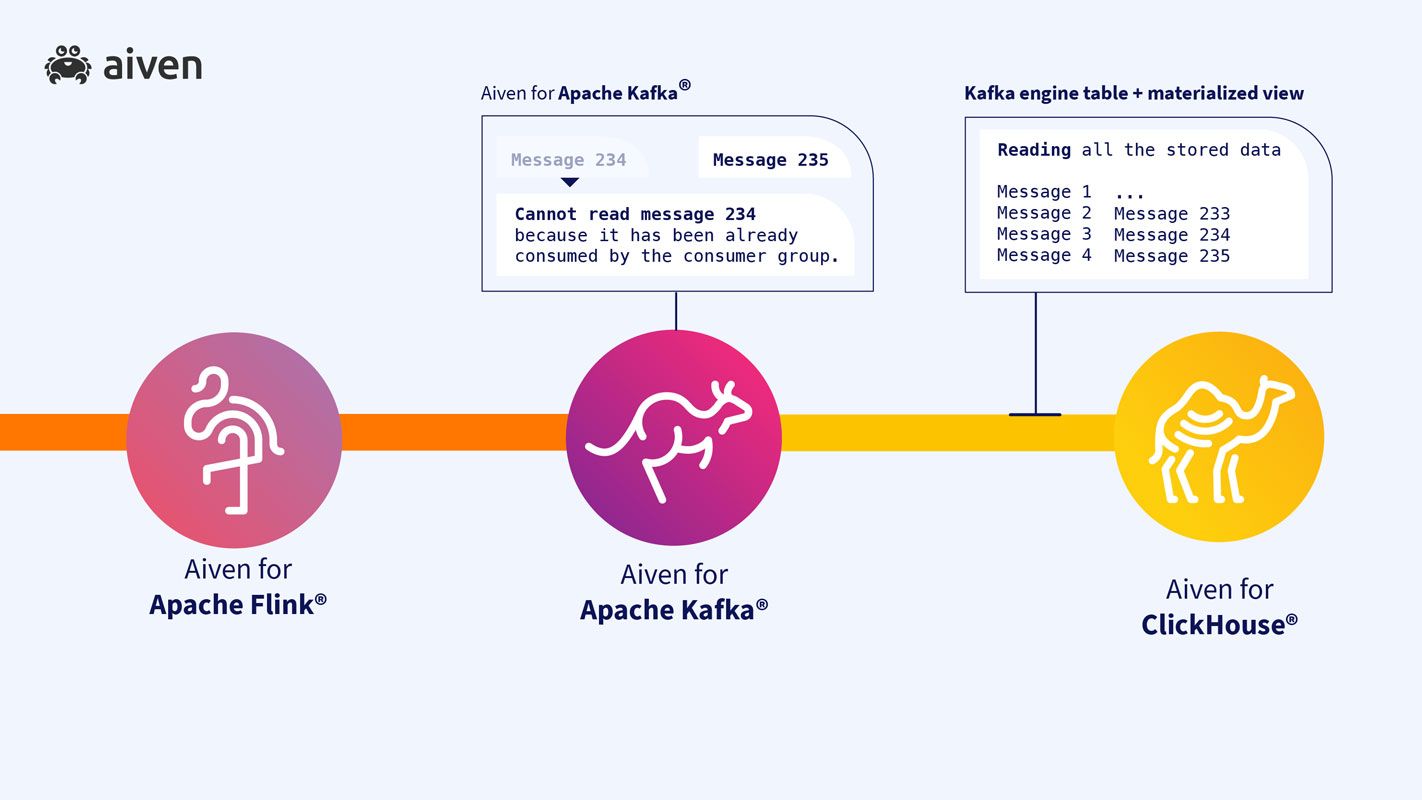
Now ClickHouse constantly reads data from Kafka in the background. The data trickles through into the materialized view and is persisted so we can query it over and over again.
Wrapping up
And that’s it. With these tools and this know-how, you can navigate the underground to create value and innovate with your own data systems.
Build a streaming anomaly detection system
Use Aiven for Apache Flink® for data transformation, Aiven for Apache Kafka® for data streaming, and Aiven for PostgreSQL® for data storage/query.
Read tutorialFurther reading
- Build what you’ve seen in this article in GitHub using the Aiven Terraform provider
- Learn how to perform analytics with fast response time over huge volumes of data without the need to downsample data. Connect Apache Kafka® and Aiven for ClickHouse®
- Set up an Aiven for Apache Kafka / Aiven for Apache Flink integration using the Aiven Terraform Provider
- What is ETL?
If you have any other feedback or questions, drop in on Aiven at Twitter or LinkedIn. Make sure to follow our blog RSS feeds and take a look at our documentation, and if you want the latest news about Aiven and our services - plus a bit extra on all things open source - subscribe to our monthly newsletter!
