Enormous amounts of data: Tens of thousands of nodes, thousands of metrics for each; 40 million unique metrics data points, most of them twice every minute; 1.3B unaggregated non-replicated time series in storage; 1TB of unaggregated data per week.
Very fast scaling.
The challenge
Aiven has a few business requirements that further impact the choice of solution, in addition to the general pain points listed above; or maybe supercharging the pain they cause.
Firstly, Aiven’s system generates a huge amount of data. We have tens of thousands of nodes running, and we collect thousands of metrics for each node. At any one time, we currently process 40 million unique metrics data points, most of them twice every minute. We have 1.3B unaggregated non-replicated time series in storage. In just one week, the amount of unaggregated data currently amounts to about 1TB.
And on the other side, we have hundreds of different alert rules that are triggered by these metrics.
This means Aiven needs a very robust solution, one that is capable of very large and fast throughput. It also needs to be able to physically store all that data. This limits the number of solutions we can even consider.
Secondly, the amount of data keeps growing and growing. This means we also need a readily scalable solution. Companies with slower growth or in a business model that doesn’t increase the amount of monitoring can scale up at a slower pace and have a bit more time to plan and execute.
Added to that, when Aiven started out, we were just another tiny startup, strapped for cash but filled to the brim with programming experience. So naturally we looked for inexpensive solutions that we could use our experience and expertise to integrate into a proper observability platform.
And to top it off, we definitely wanted to go open source. Not just for the price but also because it’s just what we do with our lives.
Eventually, after many iterations, we’ve come up with an overall solution for internal observability that addresses these points and does a pretty good job. Well okay, an excellent job in fact.
We’re seeing a lot of other companies out there struggling with their monitoring solutions. We now invite you to take a step back and look at the larger picture. We offer a way out of the labyrinth of multiple monitoring tools, up onto the promontory offering a magnificent, integrated view of your data status.
"We promise our customers 99.99% uptime. That's a tall order. We need to see what our systems are doing all of the time, and when things go wrong we need targeted information about it in order to fix it quickly."
Mika Eloranta
Head of Technical Operations
The solutions
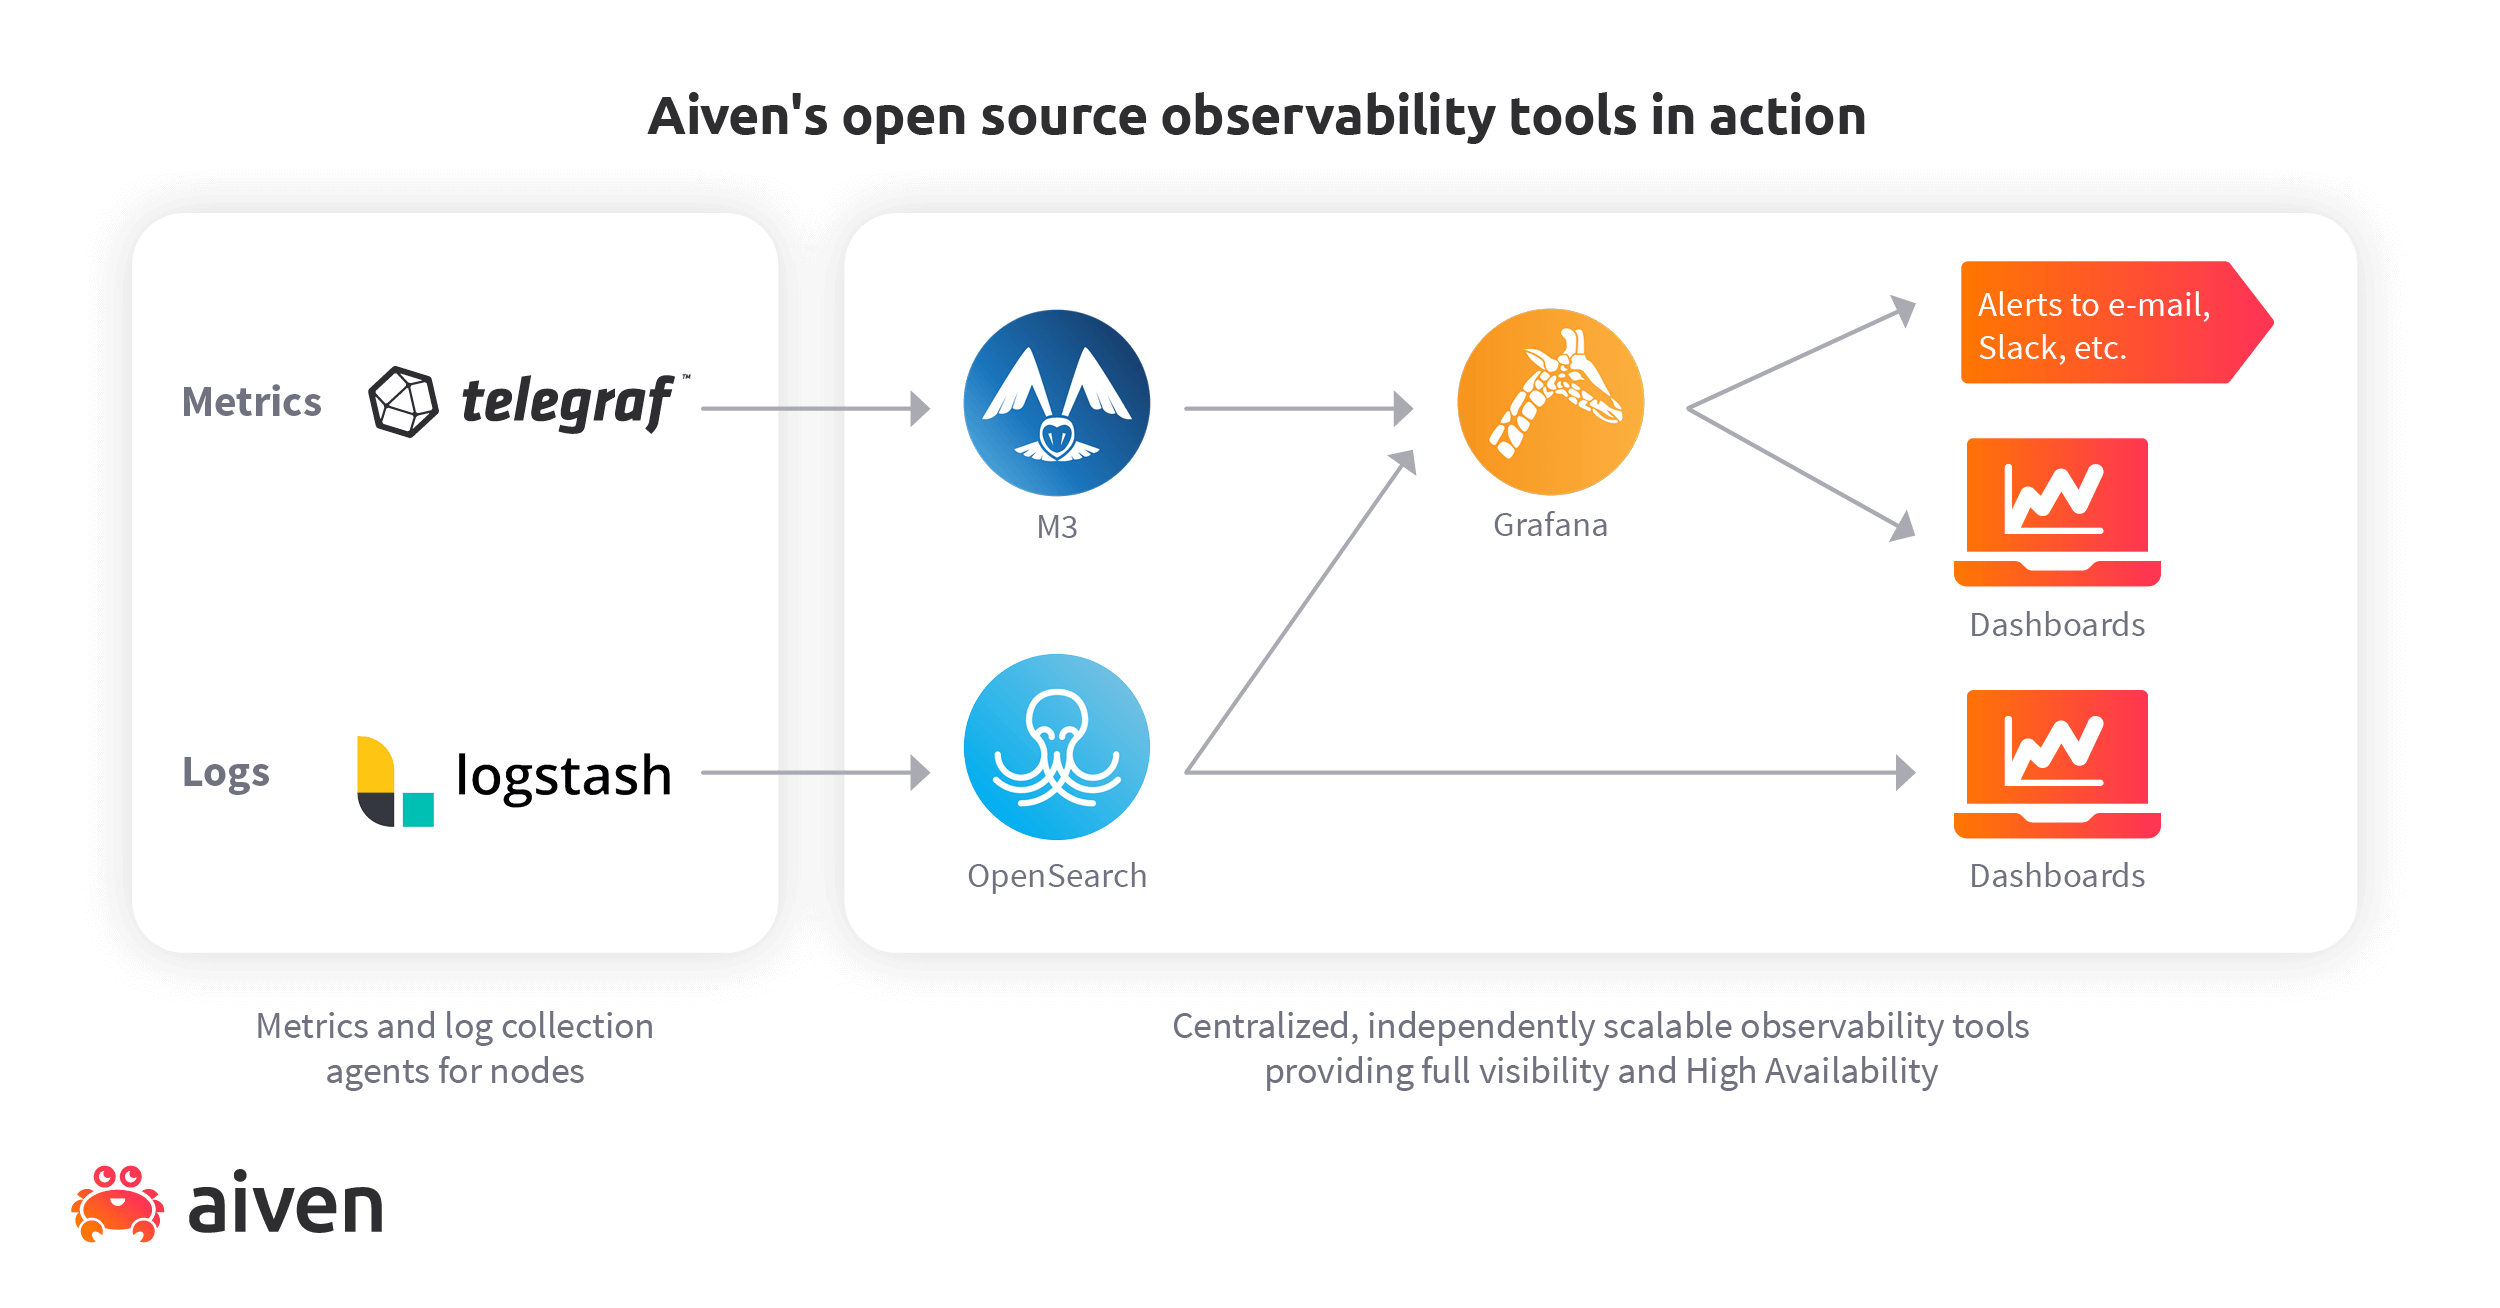
We’ve been using this solution (or its direct predecessors) for years because it’s robust and versatile. The building blocks we’ve used to construct our solution are:
M3 as a metrics engine
Grafana® for dashboards and alerts
OpenSearch for examining logs, combined with OpenSearch dashboards as a search UI
These plug into agents collecting metrics and logs, Telegraf™ and Logstash respectively.
Aiven actually started with InfluxDB® as our time series database, but the increasing number of metrics we collected forced us to find something new. On a practical level, the InfluxDB based solution generated duplicate alerts which was annoying.
“M3 was the best heavy-duty option,” says Markus Stenberg, one of Aiven’s Staff Software Engineers. “It’s used by several large companies and it’s horizontally scalable. Its architecture is also simple enough to be robust and comprehensible.”
“It’s not perfect by any means, but we’ve done our best to plug the biggest holes. For example, upstream M3 is network-intensive because it doesn’t compress traffic. We’ve built compression into our own branch, though, and now we’re just waiting for the upstream project to merge our work,” Stenberg says.
Our own use of M3 was what gave us the idea to start offering Aiven for M3 so that you, too, could benefit.
Comprehensive logging
We use logs for multiple purposes. “They’re like the Swiss Army Knife of data collection,” says Eloranta. “Log entries are easy to collect, move and transform using open source components.”
In troubleshooting, it’s helpful that we collect so many logs. You often don’t know what you’ll need before you need it, and having fine-grained data helps us analyse fault situations quickly and accurately.
Listening to the heartbeat
But Aiven doesn’t just rely on logs for failure detection. Many layers are needed to ensure that alerts are triggered correctly.
Aiven uses heartbeat-based monitoring to complement the telemetry collection. This ensures that if the telemetry-producing systems go down, the receiving systems don’t just sit there waiting for a signal that never comes. Instead, they know they’re supposed to be receiving a ping, so if nothing happens, it triggers an action because something is wrong.
Alert rule maintenance
We also keep working on our alert rules all the time to ensure that they cover all possible failure cases. That work will never be finished, because there’s no way for any list of failures to be complete and comprehensive, but we’re making the serious effort anyway.
“Let’s say one of our ops team members notices we’ve run out of file descriptors, for example,” says Eloranta. “This makes them realise it’s a good case to build an alert for. So because we already collect the metrics, it’s easy to create a graph in Grafana to discover the normal variation in file descriptors used. That figure can then become the basis for a new file descriptor use alert.”
Alerts incoming
When a fault has been detected, the Aiven team is notified by several concurrent and consecutive channels, like phone alerts and Slack messages.
But since Aiven’s system has so many alerts configured, doesn’t the team get a bad case of alert fatigue? Eloranta says no.
“It depends on how robust your system is,” he says. “If you have lots of alerts and your system is on fire every day, of course you’ll stop paying attention to them. That tells you to shift your focus from reactive to proactive and start fixing the system. Aiven has always addressed the root causes first. You can’t avoid alerts altogether in a big system, especially in the cloud, but you can try.”
"M3 was the best heavy-duty option. It’s used by several large companies and it’s horizontally scalable. Its architecture is also simple enough to be robust and comprehensible."
Markus Stenberg
Software Engineer
The outcome
If you take a look at the graphic above, you’ll note that a lot of those building blocks are available through Aiven. You can in fact build a system similar to ours using Aiven products.
True, you could just sign up for a complete service package like Datadog to get all of these observability goodies. Also true that it’s easier than assembling your own. However, it’s also more expensive, and will leave you locked in with their offering, which Aiven’s open source tools will never do. (We’d also like to make the case that building stuff is fun, so Aiven will provide you with that extra pleasure!)
Just as a side note, let’s make the context crystal clear: Aiven’s observability solution can be copied directly to keep an eye on absolutely any system. We’re not talking about monitoring Aiven services here. We’re saying you can take this solution and use it to observe whatever it is you’re currently observing, or still building.
Exactly what components you need depends of course on what you already have, but let’s just take a stroll through the complete roundup.
Metrics
If you’re already using Prometheus or Graphite as your monitoring solution, you can just plug Aiven for Metrics into that. Otherwise, you can use something else like Telegraf to collect the metrics and pass them right on to M3.
Logs
Logstash is a great open source component that can then forward the logs it collects to Aiven for OpenSearch®. To make your logs more usable, you can set up OpenSearch dashboards as a user interface, too. It’s included in Aiven for OpenSearch.
Visualisation
Aiven for Grafana® is a great way to collect Everything™ into a UI for easy access. You can also use it to configure the system to send alerts and updates through other channels.
With Aiven’s solution, you get the familiar Aiven Console or CLI to set up the whole kaboodle, and you can do that in minutes.
As the icing on the cake, you can be sure that your solution works, because Aiven’s business literally depends on it working. That’s why we’ve done it this way. “We eat our own dogfood,” says Eloranta. “Because we use the products we offer to customers ourselves, we know how they work from a user perspective, and how to keep them working for our customers.”