Sep 27, 2022
What is Grafana®?
By combining and correlating data from any source in one dashboard, Grafana® ensures your team is always on the same page.

Floor Drees
|RSS FeedStaff Developer Advocate
What’s Grafana all about?
Made and maintained by Grafana Labs since 2014, Grafana® has become one of the most popular open source projects on GitHub. Why’s that, you ask? Because Grafana can give (distributed) teams that single source of truth when it comes to the health of their project.
Grafana allows you to query, visualize, alert on and understand your data no matter where it is stored. By combining and correlating data from any source in one dashboard, your team is on the same page - always.
And when we say any source, we mean it. Grafana’s plugin catalog is vast, and growing. Today Grafana supports 290 plugins, of which Aiven offers 62 - way more than some of the big Cloud vendors. Grafana starts making sense when it's connected to more sources and allows you to connect the dots between your Splunk, Oracle, MongoDB … and when you’re missing a data source, you can always use the general purpose Infinity plugin to visualize data from virtually any JSON, CSV, XML, GraphQL or HTML endpoint.
Aiven for Grafana® is a fully managed offering of the multi-platform open source analytics and interactive visualization web application that is Grafana.
Grafana’s benefits and uses
Debugging: Teams use Grafana for ad hoc troubleshooting. Different teams often use different tools, and access might not be shared across those groups. When Grafana has query access to your monitoring applications, you’re all looking at the same spikes and you can get to a plan of action quicker.
Observability: Grafana visualizes time series data as a graph, allowing you to observe how your application behaves over time. What’s more, Grafana dashboards offer insights to all kinds of stakeholders, regardless of their technical skills, thanks to the customizable abstraction layer for visualization.
The boy who cried wolf: Use the Mixed view to combine alerting data from data sources, and only notify your on-call team when alarm bells go off at Pagerduty and Datadog and New Relic. Waking people up over false positives is a surefire path to alerting fatigue.
How to get started with Grafana
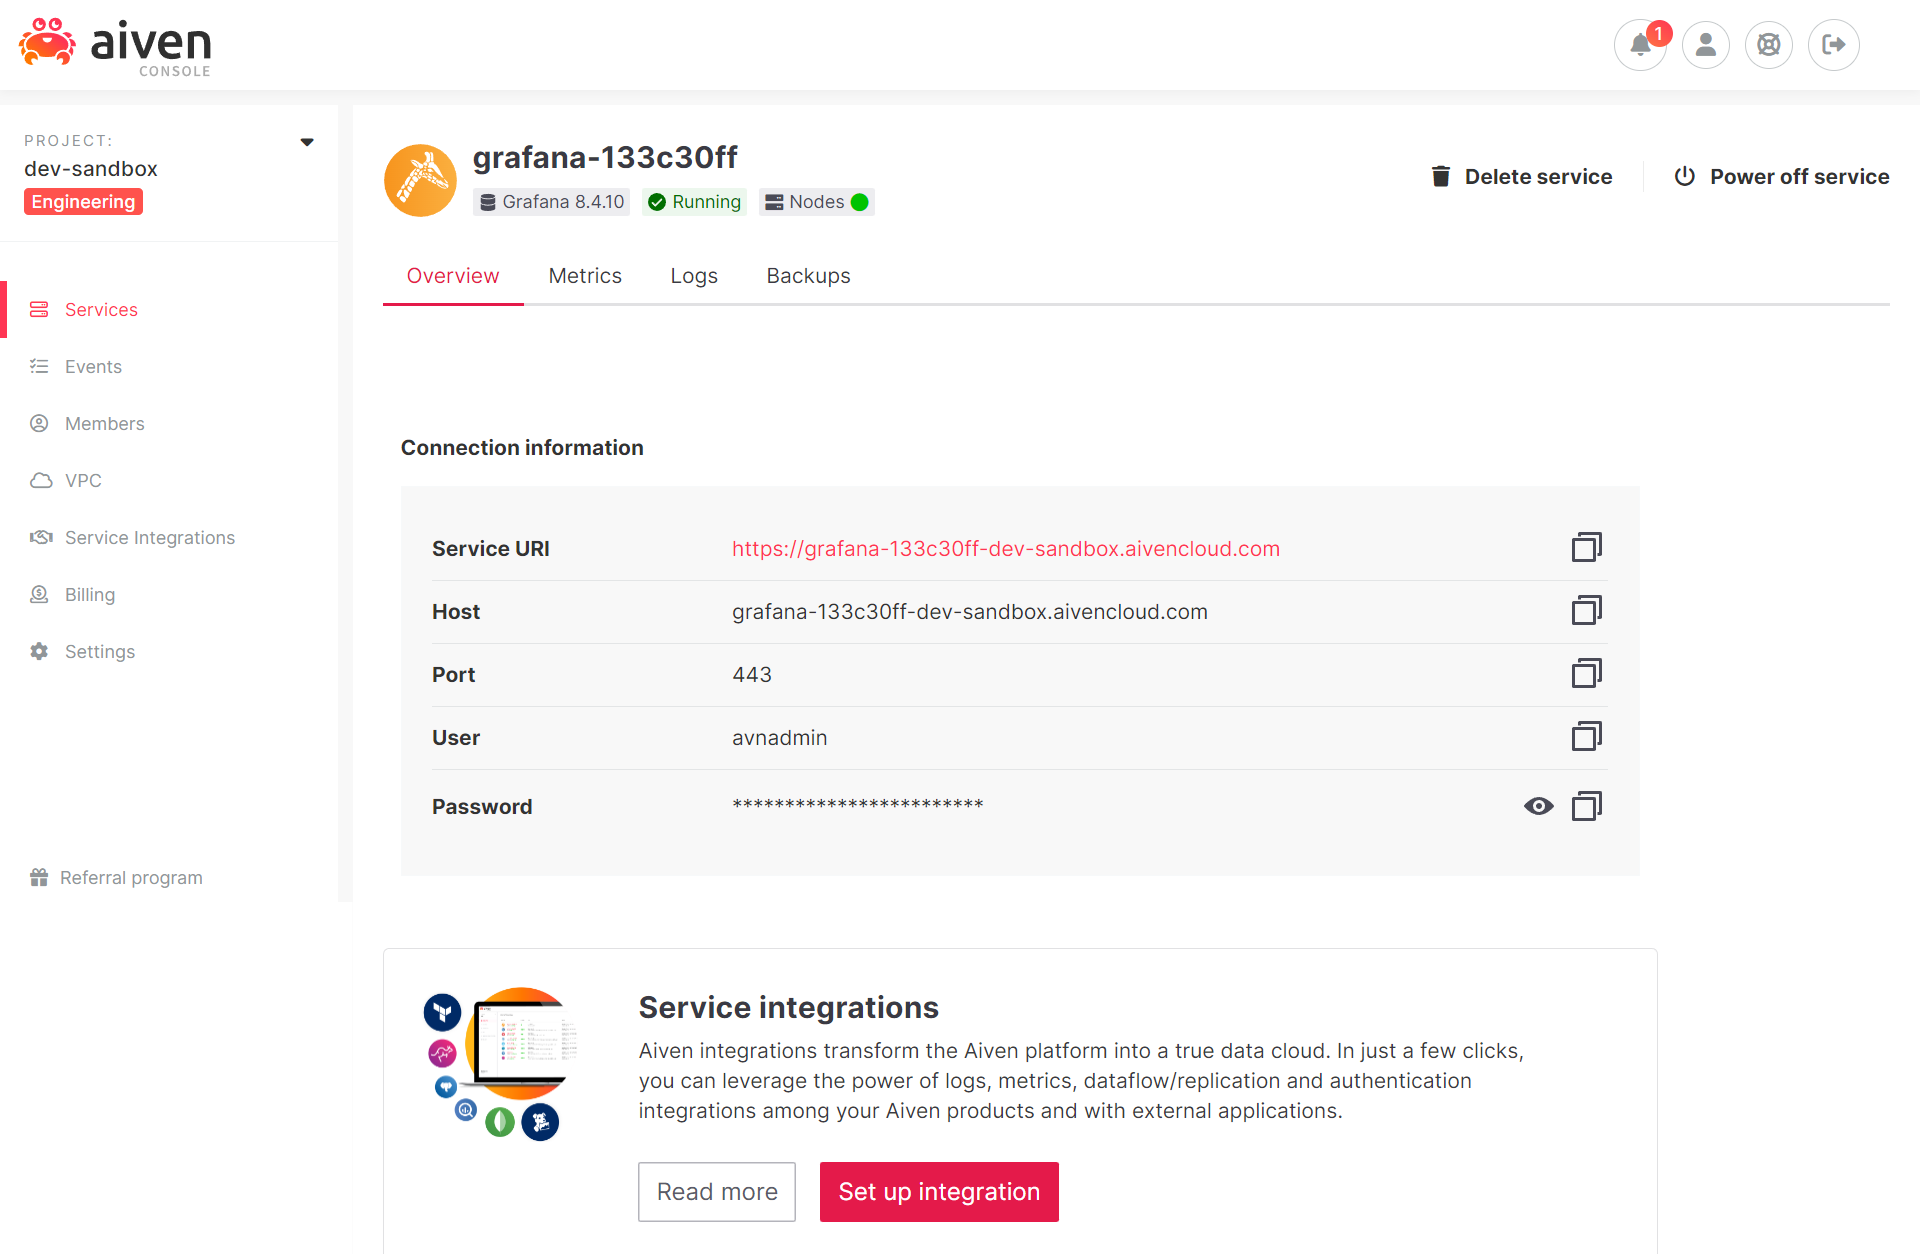
Navigate to the Aiven Console and create a Grafana service on a trial account. Copy the generated password, and select Service URI to leave the Console and go to Grafana.
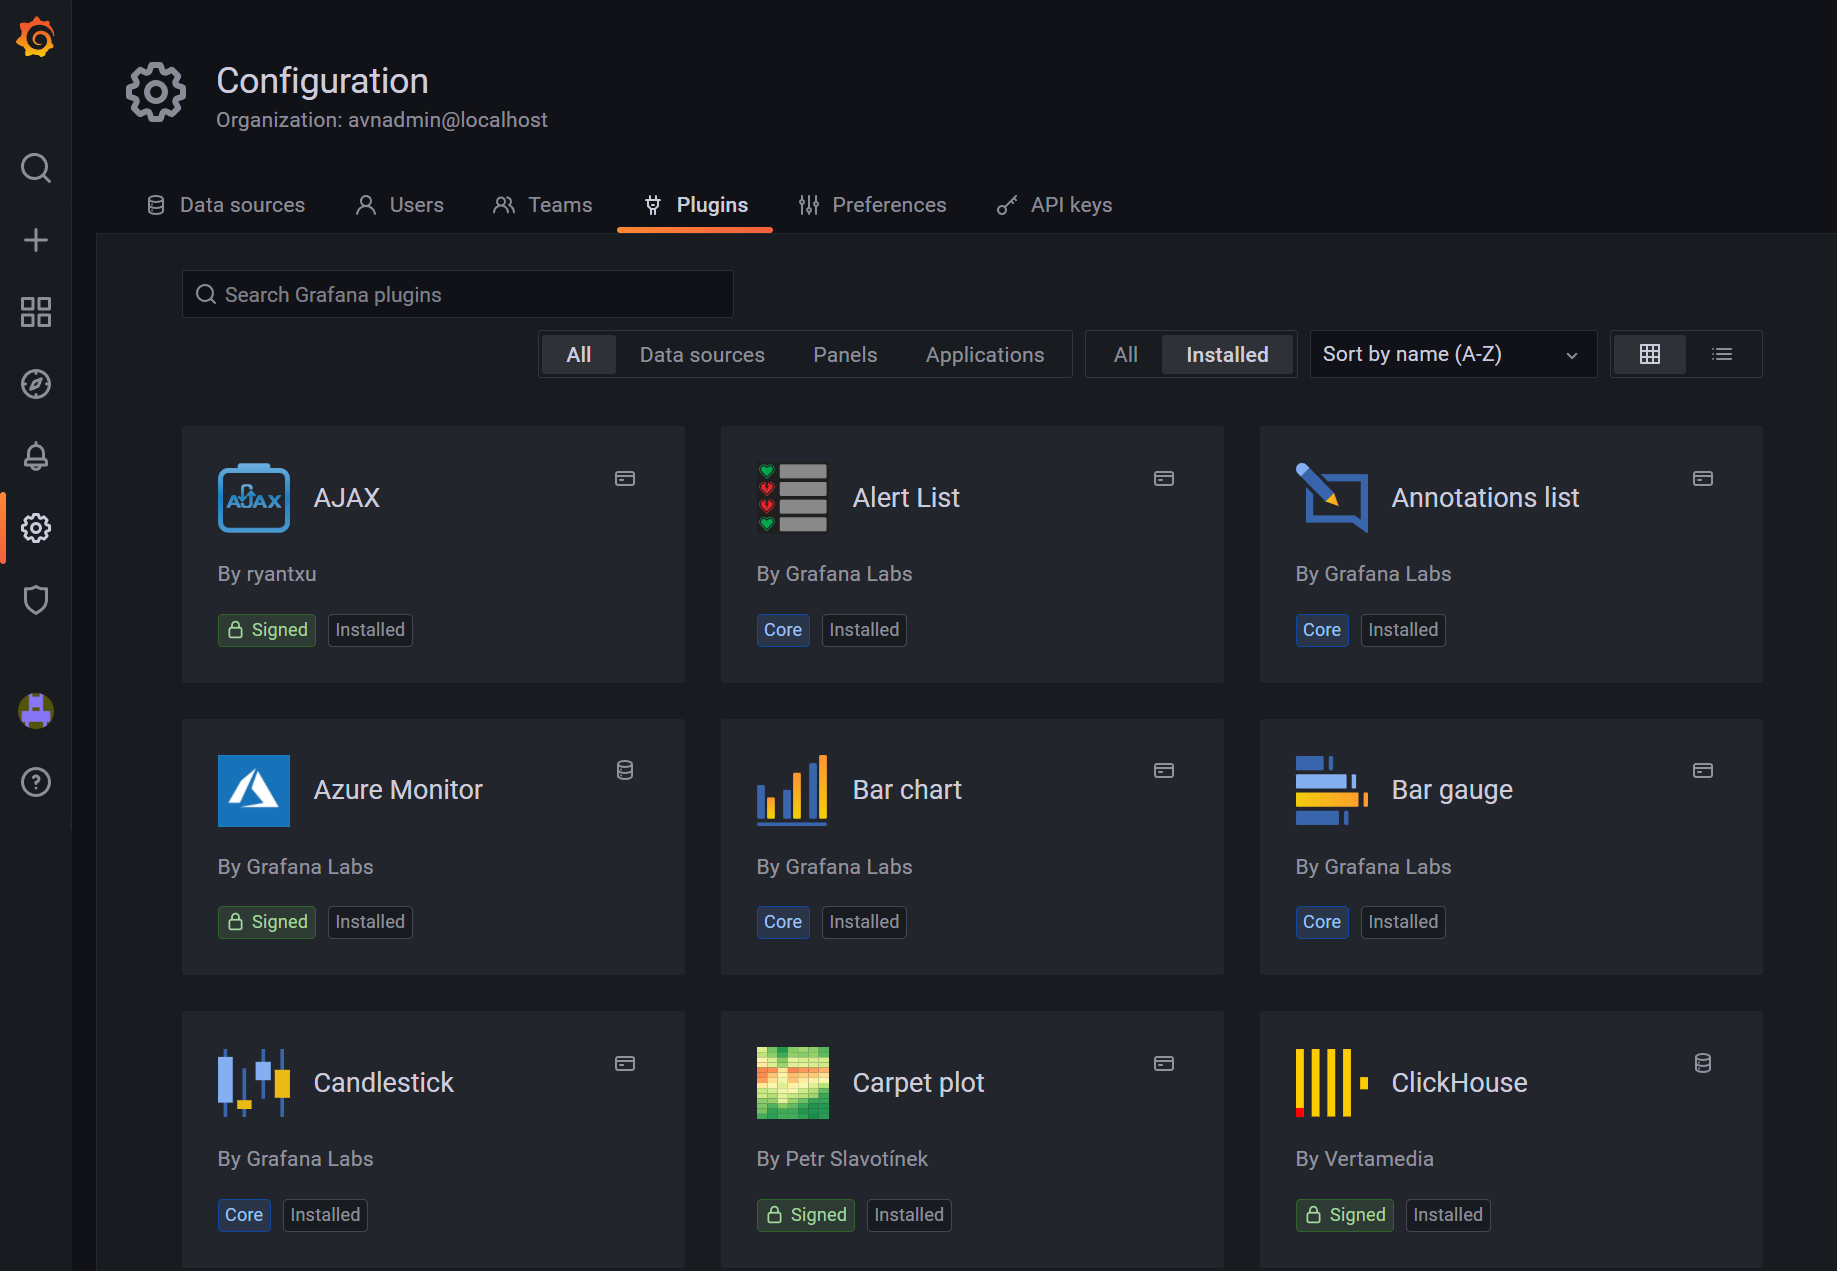
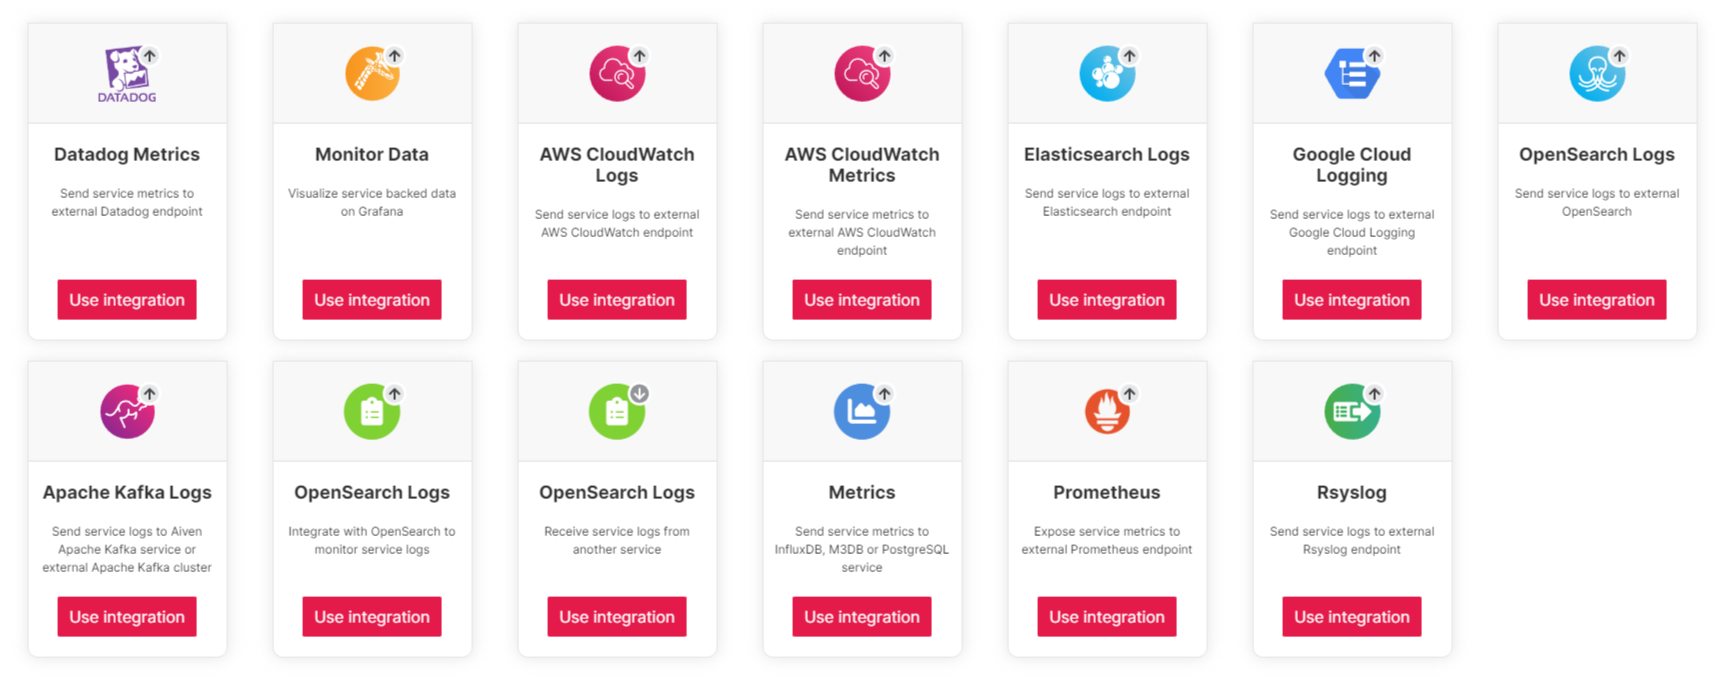
To add data sources that are not available from our service integrations, navigate to Configuration > Data sources, and Configuration > Plugins for a list of available plugins (including but not limited to data source plugins).
Let’s say you want to track and understand the health of my OpenSearch® instance by visualizing its metrics. Go back to the Aiven Console and create an OpenSearch instance there as well. In this example we're running a very barebones OpenSearch cluster that we want to observe. For that, you need the Metrics integration to send service metrics to M3, which is very suitable for time series data.
Create a new M3 service right from the service integrations window.
Now you need M3 to collect data from OpenSearch, and send that to Grafana.
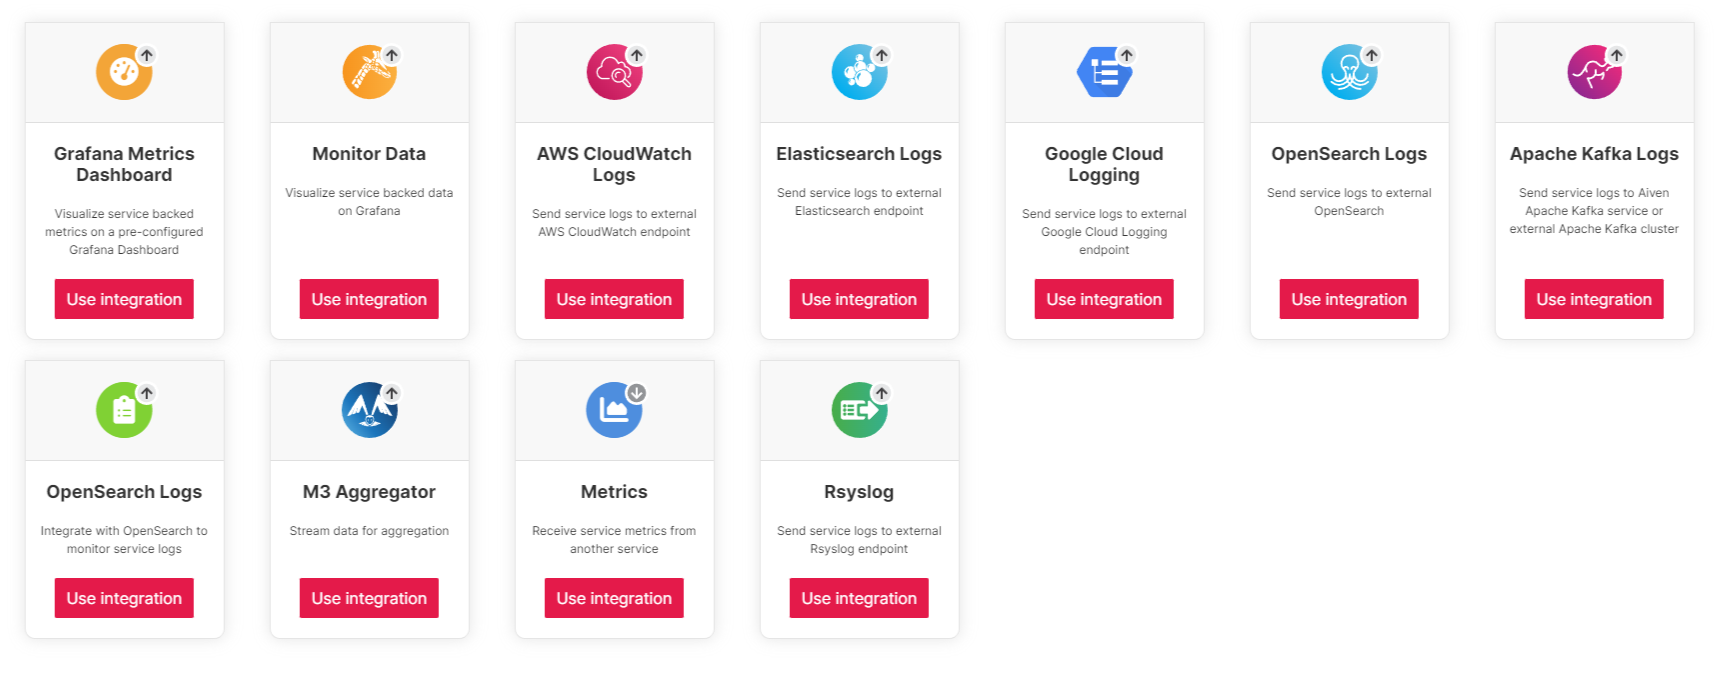
Select the Dashboards integration and connect M3 to your existing Grafana instance.
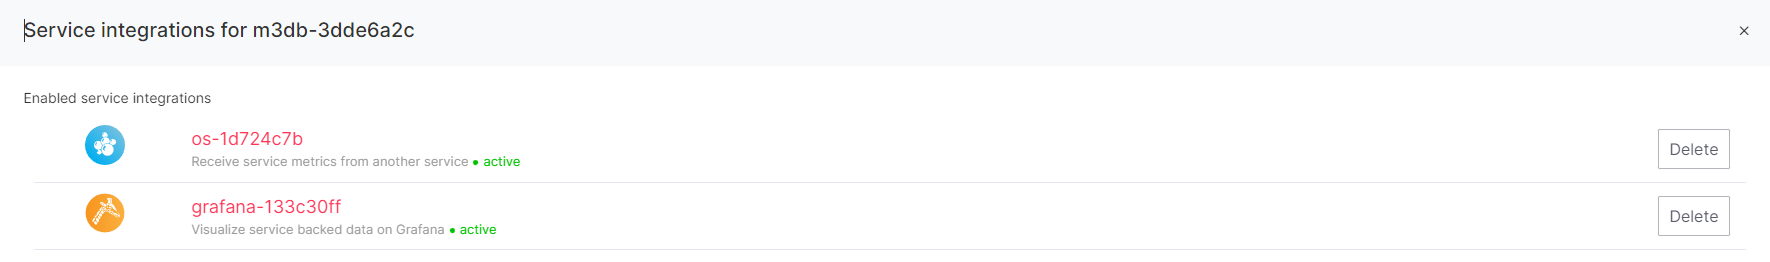
M3 now collects data from OpenSearch, making it accessible for visualization.
Go open Grafana and browse the dashboards. When you select the prebuilt dashboard, the data begins to roll in and you can start to see graphs and charts. You can also edit your data source to make it collect data on shorter intervals, if you’re in a hurry.
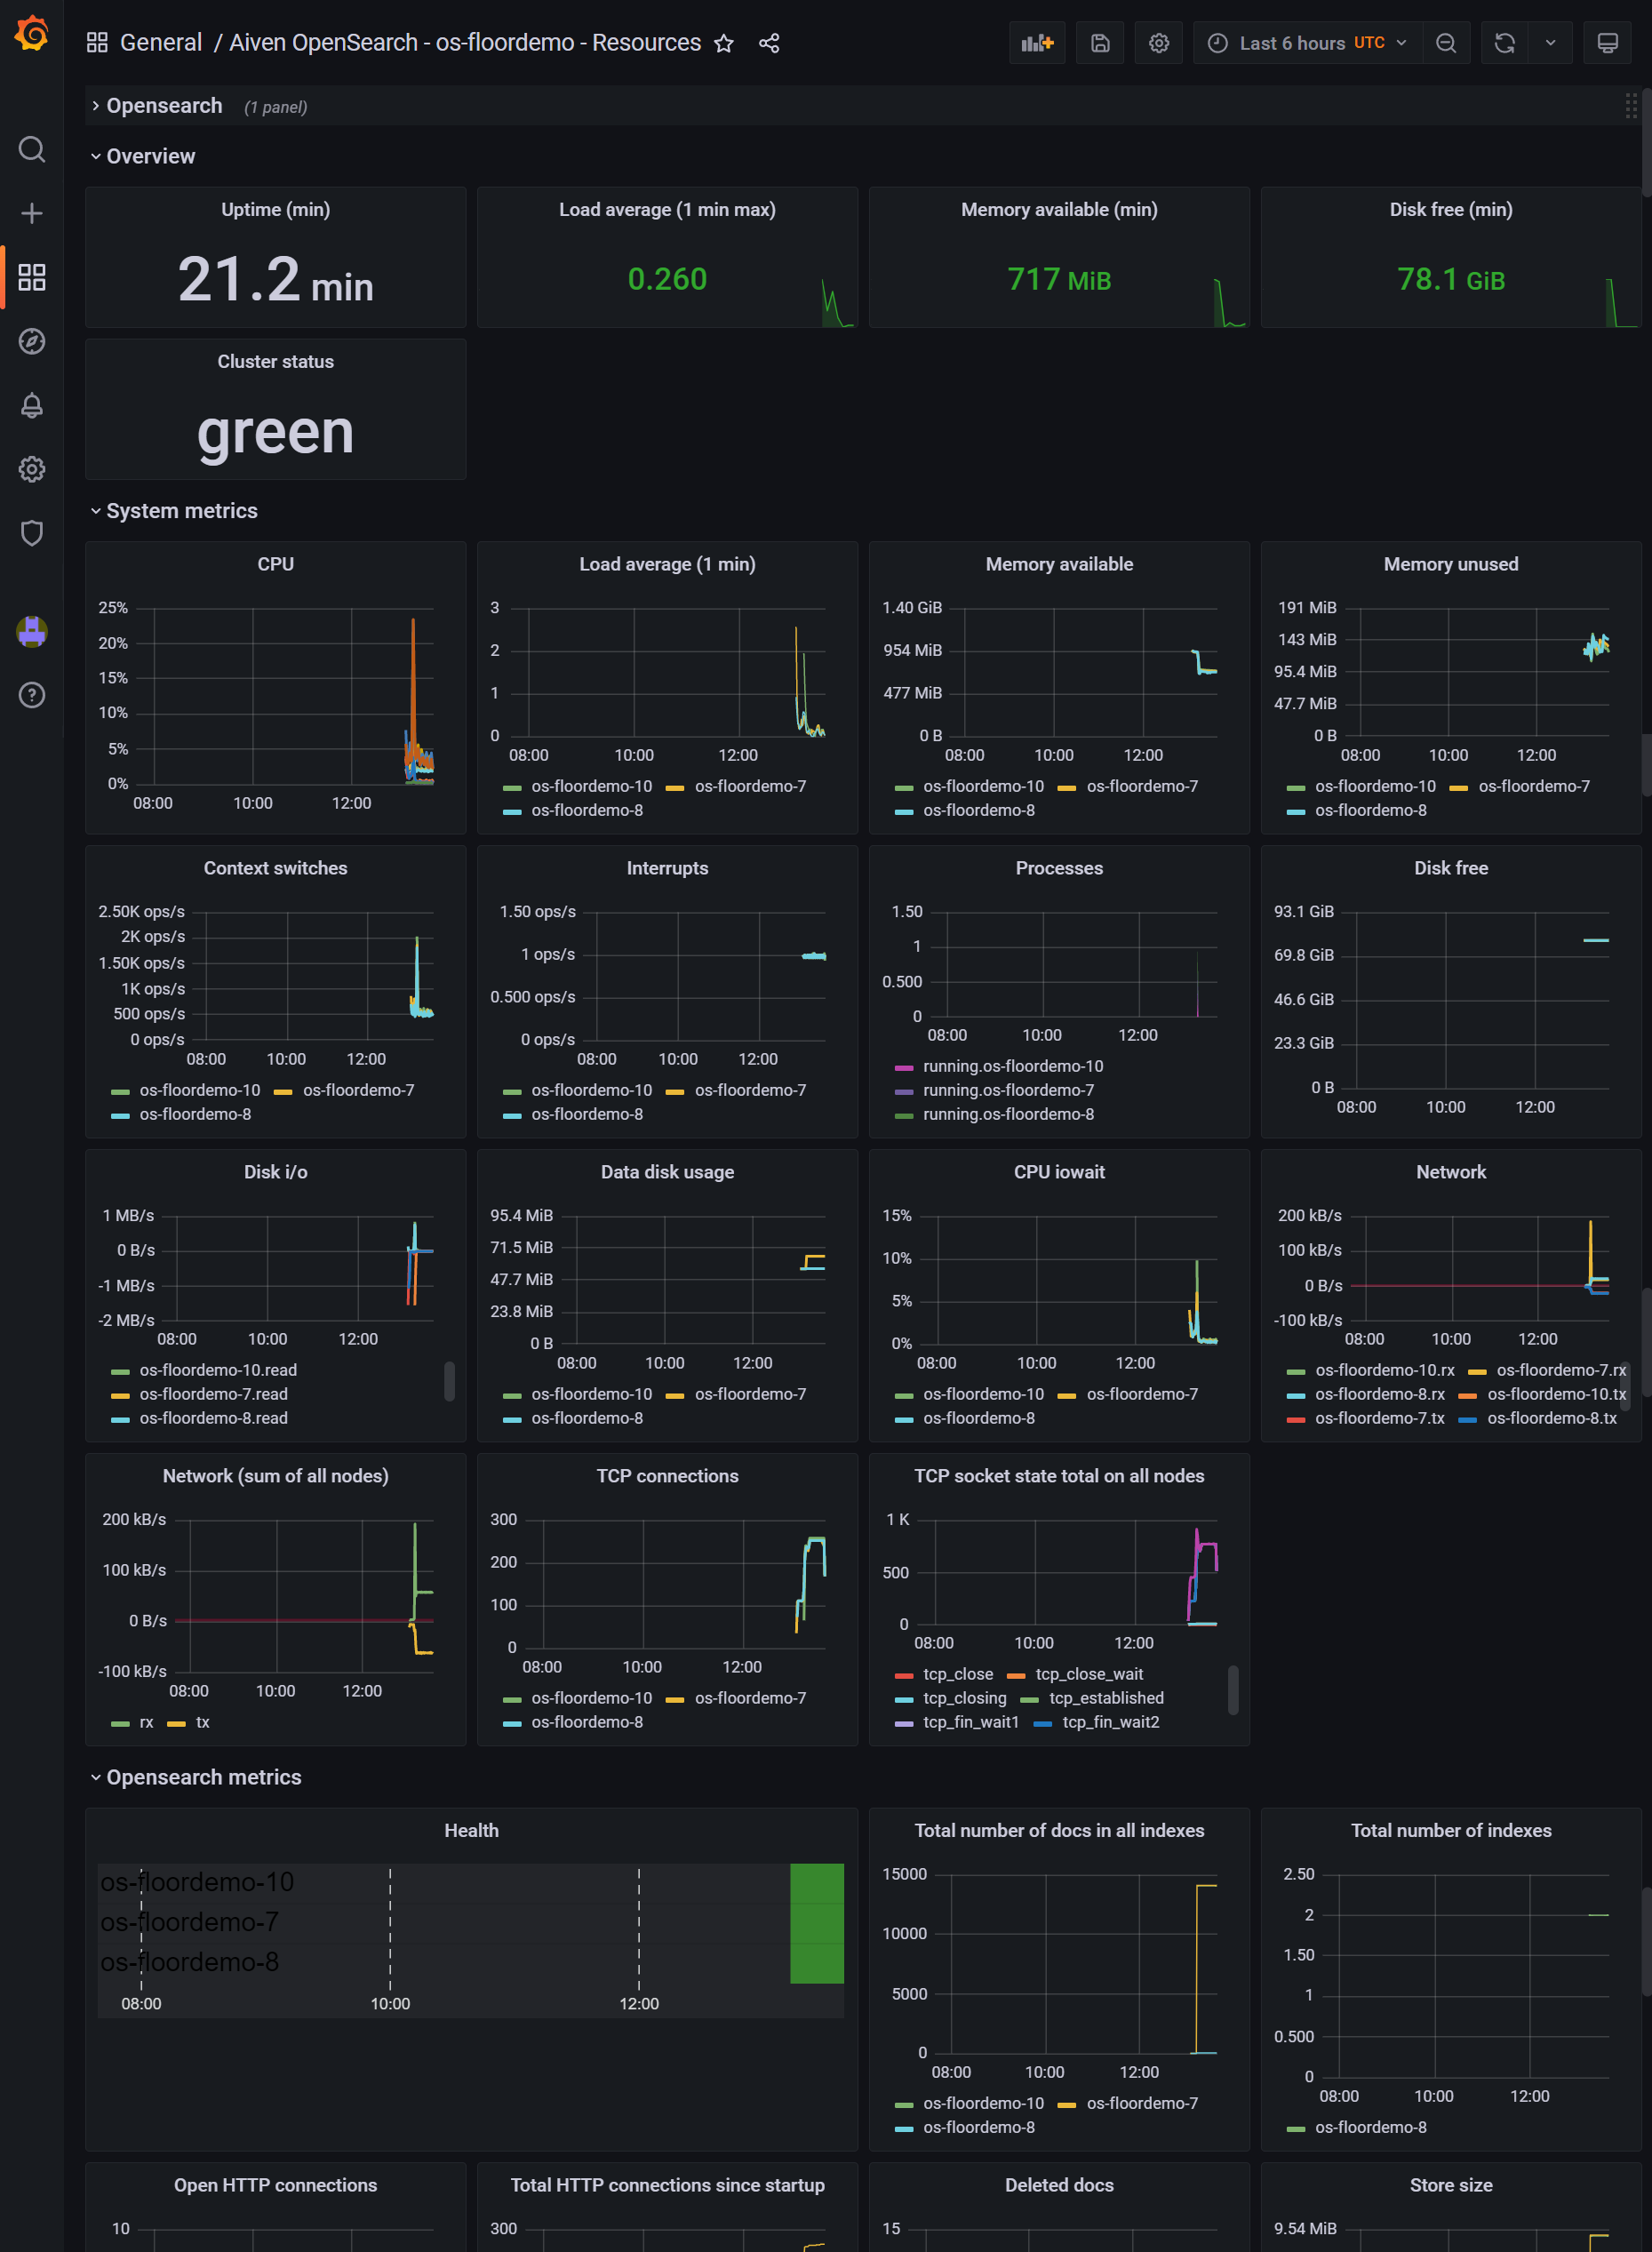
Now that you've got your dashboard, you can drag and drop panels as you'd like. Remember to rename the dashboard when you make changes, though! Otherwise, with the next update, the dashboard resets to its default settings.
Next steps
One of the attractive features of a managed services platform like Aiven is the extensibility of each individual service. Grafana is highly compatible with other Aiven products. You can set up your other Aiven services as data sources for Grafana, like PostgreSQL®, MySQL, ClickHouse®, OpenSearch® and InfluxDB®, monitor their health, and perform queries.
Build a proof of concept with Grafana, and soon enough you'll find yourself sharing dashboards with your team members when you’re analyzing traffic spikes, or investigating performance issues.
--
If you have any feedback or questions, say hi to us on Twitter or LinkedIn. Make sure you follow our changelog and blog RSS feeds, and if you want the latest news about Aiven and our services - plus a bit extra on all things open source - subscribe to our monthly newsletter!
Further reading
Stay updated with Aiven
Subscribe for the latest news and insights on open source, Aiven offerings, and more.