


For an organization to have trust in their monitoring solution, it’s imperative to be able to contextualize the information it provides. Has a particular alert caused problems before? How can a user’s experience be tracked across dozens of interconnected services? The latest version of Aiven for Grafana® makes answering these questions easier than ever with an upgrade to Grafana® 10.
Upgrade process & breaking changes
Existing Aiven for Grafana instances will be automatically upgraded to Grafana 10 during the next scheduled maintenance window automatically. Customers who would like to get started sooner can apply the maintenance update manually via their Aiven console.
Aiven thoroughly tests our upgrade process and packaged plugins to ensure a smooth transition. A thorough list of deprecations and breaking changes can be found in the Grafana docs.
New and noteworthy in Grafana 10
Below, I’ve collected some exciting highlights from this release. For a full list of updates and public previews, see What’s new in Grafana v10.0 in Grafana’s documentation.
Custom content of all sizes
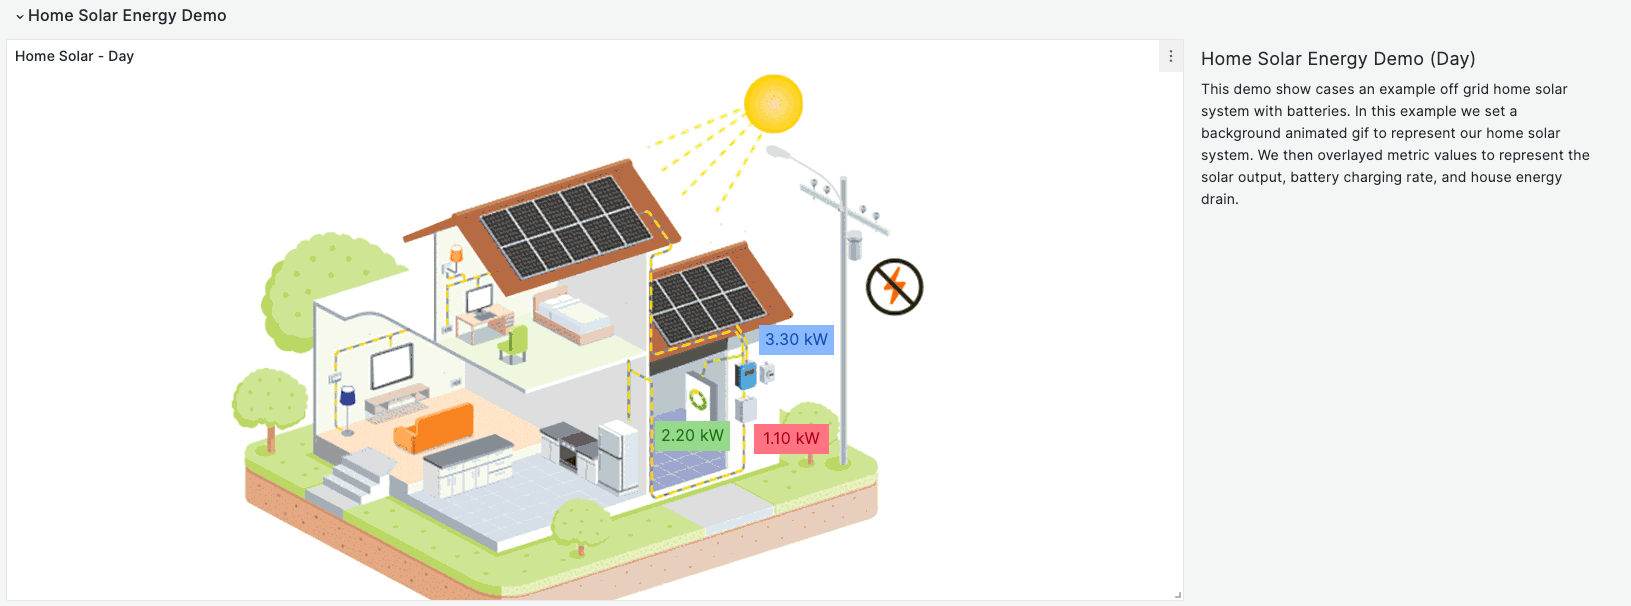
With the release of Grafana 10, the canvas panel has been promoted into general availability. This new panel combines the power of Grafana with the flexibility of UI and web design tools to help you build dynamic visualizations custom tailored to whatever’s most important to your organization. For detailed run-down of the canvas panel’s evolution, complete with a collection of illustrative demos, be sure to check out this blog post from Grafana’s engineering team.
Not all customization needs to be quite so elaborate. Sometimes, all you need is a little extra context in your charts and graphs. With time region support, you can define specific time ranges (e.g. “business hours”, “maintenance window”) as annotations for your time series data. This ensures you can quickly identify relevant data within a known time window at a glance.
More ways to add and compare data
Custom graphs and dashboards won’t go very far without data for them to visualize. To make loading data into Grafana even easier, the data source picker has been streamlined. Recently used content is easier to find, and labels and supplementary descriptions have been added to make adding new data sources a snap.
Speaking of data sources, the Azure Monitor data source has been updated with support for visualizing Application Insights Traces. A corresponding “traces” query type has been added to the query editor to facilitate querying Application Insights Traces.
This release also introduces a data plane layer, wherein schemas have been defined for a variety of data types. This helps ensure improved reliability and interoperability across the platform. Each data type consists of a combination of a “kind” (e.g. TimeSeries) and a “format” (e.g. Wide). The full list of data types can be found in Grafana’s data plane contract.
Next Steps
This is all just a sampling of the new features and previews available in Grafana 10. You can find a full list of what’s new, as well as breaking changes in the Grafana docs.
Not using Aiven for Grafana yet? Now’s a great time to start! Check out the Aiven for Grafana product page for more information.
