

From the outside looking in, trucking may seem like a fairly well-organized industry, but the reality is somewhere closer to organized chaos. From the dreaded D.O.T week, where capacity drops as truck drivers stay home to avoid inspections, to hurricanes that halt transit for an entire portion of the country, the freight market can change at the drop of a hat.
On an individual shipment level, there’s even more uncertainty — accidents, facility closures, damaged cargo, among many other things. The number of things that can go wrong in the lifecycle of a shipment is astounding. One element that’s helped Convoy thrive in spite of this chaos is our investment in building a robust and accessible data warehouse.
All of the data from our rapidly growing number of services is continuously piped into our data warehouse, where it’s made available for all employees to use. Everyone at the company is encouraged to learn SQL so they can build the queries and dashboards they need to do their jobs effectively.
For example, account managers can build dashboards to answer unique questions our customers might have about their freight, and our operations team can make data-driven decisions about improvements to their workflows, which improves our quality of service to customers.
You hear the term “data democratization” tossed around frequently, and Convoy is the closest I’ve seen a company get in practice. There’s no doubt access to comprehensive and fresh data has been a key factor in Convoy’s ability to scale successfully.
Stretching the Limits of Our ELT System
Unfortunately, as Convoy has grown to 700+ employees over the past year, the one thing in this picture that wasn’t scaling well was our ELT system. ELT, which stands for Extract Load Transform, is the process of extracting data from our various production services, and importing it into our data warehouse.
Previously we had relied on a third party service to handle this work for us, but our import latency increased as we continued to scale. Data that used to take 10–15 minutes to import now frequently took 1–2 hours, and for some of the larger datasets you could expect latencies of 6+ hours. As you can imagine, knowing where a truck was 2 hours ago when it’s due at a facility now isn’t very useful.
Several teams had already started building workarounds to pull real-time data from our production systems with varying degrees of success, and it became increasingly clear that access to low latency data was critical. At this point, we realized we had two options:
-
Change the scope of the data warehouse to only support offline analysis, and have product teams build the dashboards the company needs hooked directly up to our production services
-
Build a new, low latency, ELT pipeline
Both options required work from the engineering team, but the second option would allow us to continue to use our data warehouse as the central source of data for the company. In order for this project to really be considered a success, we set an aggressive latency goal of just 5 minutes from the time a transaction was committed in one of our databases to the time it was available to query in the data warehouse.
After speaking with teams across the company, we settled on 5 minutes as an achievable compromise to true real time data. In addition, we wanted to ensure we never lost data in transit. Zero data-loss was an important feature of our previous solution, and is critical to building and maintaining trust in our data warehouse.
Earlier this year we went live with our new ELT pipeline, and have been very happy with the results. Given how much we relied on the open source community to complete this project, I wanted to give back by sharing our experience building this system. In the first part of this post I’ll cover how the system works: the design, the open source components we use, and how they all fit together. After that, I’ll dig into why the system works, or specifically, the core concepts that allow us to achieve sub 5 minute latency with guaranteed at least once delivery.
Design
At a high level, the flow of data through the system is pretty straightforward, but like most things, the devil is in the details. The pipeline starts with a change in a Postgres database, and ends in our data warehouse (Snowflake) with data ready to be consumed by anyone in the company. In between, the events flow through Apache Kafka, land in a hidden schema in Snowflake, and are cleaned up before being pushed to a public schema.
To summarize the last few paragraphs, here’s the list of requirements that drove the design:
- Low Latency
- Zero Data Loss
- Low Maintenance
I ended up learning a lot of new things about systems that I’ve been using for several years as our team worked our way through the design, initial prototype, and final implementation. Several of the topics probably deserve a post of their own, but I tried my best to condense the important points about each component to give you an idea of how they all fit together.
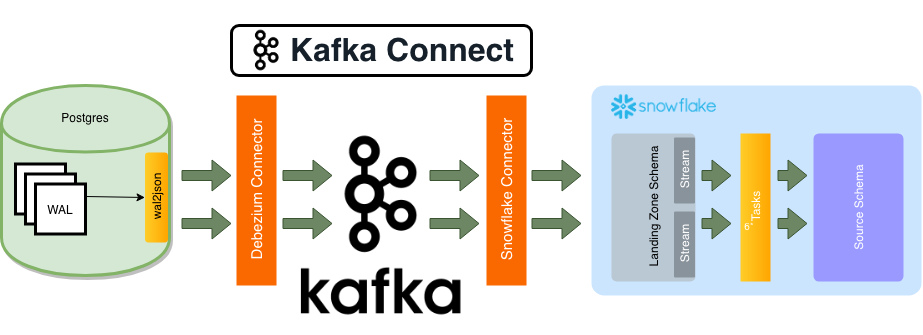
Debezium Source Connector: The most complicated part of this system is figuring out how to efficiently monitor for changes to rows in Postgres, and produce an event for each change (a process known as Change Data Capture). Fortunately for us, there’s an amazing open source project dedicated to doing exactly that — the Debezium Project. Specifically, we use the Debezium Postgres Source Connector, though they also support several other common databases like MySQL and MongoDB.
The Postgres connector uses a concept called logical decoding to consume the Postgres write ahead log (WAL, sometimes also called the transaction log), and produce events for every change to a row. The records produced by the connector are a bit verbose, so we use a Single Message Transform to flatten the event to just the new values in the row.
We also needed a way to ensure proper ordering of events once they made it into our data warehouse, so I added a feature to the connector that allows us to plumb the Postgres log sequence number (LSN) through with the event. The log sequence number is just the offset in the Postgres write ahead log, which I’ll touch on in the next section.
I wanted to call out one thing that has the potential to cause a real problem if you’re not careful: Postgres’ logical decoding provides an efficient way to stream changes in your database to external consumers, but it doesn’t come without its faults. Most notably, Postgres will not delete any part of the write ahead log until the data has been consumed by all existing logical replication slots. In other words — if your consumer (in this case the Debezium connector) stops consuming for any reason, Postgres will happily keep appending to the write ahead log until its disk is completely full, and the database is unresponsive.
Using logical decoding requires sufficient disk space to buffer against temporary outages, and good monitoring to alert you early on to any problems.
wal2json:_ When you create a logical decoding slot in Postgres, you need to specify an output plugin for the slot to use. Logical decoding output plugins are responsible for decoding and converting the contents of the write ahead log into a format you’re able to consume. We use a well known plugin called wal2json, which comes preinstalled on AWS RDS Postgres instances, but there is also a plugin for Protobuf maintained by the Debezium community.
Because these events are only being used for ELT purposes, I decided to forgo schemas and the schema registry, and stick with schema-less JSON blobs. The upside of this approach goes back to the low maintenance trait I mentioned at the start, as it pushes the schema management problem out of this system, and into the models/views in our data warehouse.
Apache Kafka: At the center of our new ELT system is a Kafka cluster with one topic per Postgres table we’re replicating. This cluster is dedicated solely to ELT events, because unlike other clusters, we have auto topic creation enabled to reduce maintenance cost of the system. At the rate we’re growing, I wanted to avoid any manual steps past the initial setup for a database.
With auto topic creation enabled, when a new table is created in one of our Postgres instances, the data for that table flows all the way into our data warehouse without any intervention. We use an agent task to periodically police the topics in the cluster, and automatically make adjustments to retention policies (at least until KIP-158 is implemented).
Kafka Connect: Connect is an open source framework used to integrate Kafka with other existing systems (databases, filesystems, etc) using pre-built components called connectors. Connectors can either move data from an external system into Kafka (a Source connector), or move data from Kafka into an external system (a Sink connector).
We run a Kafka Connect cluster in AWS Elastic Container Service to move data from our databases into Kafka, and from Kafka into Snowflake. Kafka and Kafka Connect have a vibrant community, so there’s a good chance a connector already exists for the systems you use.
Snowflake Sink Connector: Unfortunately, when we first started building this system a connector for Snowflake didn’t exist. What we’re actually doing right now is using a S3 Sink Connector to write the data to S3, then auto-ingesting the data into Snowflake with Snowpipes. The data gets appended into tables in our ‘landing zone’ schema, where each table just has a single VARIANT column containing the JSON blob representing the row.
However, a couple months ago at their 2019 Summit Snowflake announced an open source Snowflake Connector, which works by pushing data to an internal Snowflake stage, and then calling the Snowpipe rest API to ingest the data. This approach has the benefit of not relying on S3’s event notifications to trigger files to be loaded, which isn’t 100% reliable. The connector is currently in preview, but once the bugs are worked out and it hits general availability we’re planning to start using it instead.
Snowflake Streams & Tasks: At this point, the data has made its way into a hidden ‘Landing Zone’ schema in Snowflake, and it’s only been a couple of minutes. Before we expose it to the rest of the company, we need to do some basic data cleansing (stuff like filtering test data, converting types, etc). At the time, we were using a combination of Apache Airflow + dbt to transform our data into useful datasets, which worked well, but isn’t really suited for low latency processing.
Fortunately for us, Snowflake recently announced a new set of features aimed at continuously transforming data called Table Streams and Tasks. A table stream, usually just referred to as a stream, is an object used to track changes to a table made by data manipulation language (DML). Under the hood, the stream keeps track of all inserts/updates/deletes in the table since the last time the stream was consumed.
This metadata makes it easy for consumers to process only updates to a table each time they run, without having to keep track of any additional information themselves. The consumer of a stream can be any DML statement, but streams are most frequently used with the new Tasks feature. Tasks are just a lightweight way of executing a small SQL statement on a schedule, though they can also be chained together to form more complex pipelines.
Instead of running hourly batch jobs in Airflow that each process tens or hundreds of thousands of rows, using tasks we’re now able to schedule over 5000 micro-batch jobs an hour that only process a handful of new rows each time they execute. Each job usually executes in 5–10 seconds, and we end up being able to skip a lot of job executions for tables that haven’t had any updates.The end result is fresh, clean data ready to be queried by the rest of the company.
Logs & Offsets
The above section describes how the system works, but doesn’t really explain why it works. Better put — given the complexity, how can we guarantee that all of the data flowing through the system will make it to its final destination, and some won’t get lost along the way?
Despite our old ELT system being a bit slow, in all the years it ran I don’t think we ever had a case of missing data. Everyone in the company trusted that the data it produced was correct, and whatever we built to replace it needed to live up to the same standard. In this section I’m going to touch on two core concepts that allow us to achieve 5 minute latency with guaranteed at least once delivery: the log, and processing with offsets.
Jay Kreps defines a log as “perhaps the simplest possible storage abstraction. It is an append-only, totally-ordered sequence of records ordered by time”. The most important aspect of the log is its simplicity, especially compared to something like a relational database, or document store. Writing to and reading from a log is a cheap operation, and is what allows us to achieve such low latency even when streaming every change to every row in our production databases. In fact, Kafka is able to easily handle millions of reads/writes a second on relatively modest hardware.
The second core concept we need, offsets, comes from the totally ordered and append-only attributes of a log, which allows us to identify any record in the log simply by its position. Offsets allow consumers to maintain their positions in the log while processing, and only advance their offset, commonly referred to as committing, when they’ve successfully processed a record. This “offset and commit” processing pattern is what gets us our guarantee of at least once delivery — if a consumer crashes before successfully processing a record, it will simply pick up where it left off the next time it runs.
Note however, it is possible for a consumer to process a record, but fail before committing the new offset, which is why we’re guaranteed at least once delivery, and not exactly once delivery. Because we run the risk of pushing duplicate events into our data warehouse, we make sure to de-dupe the data before exposing it to our consumers.
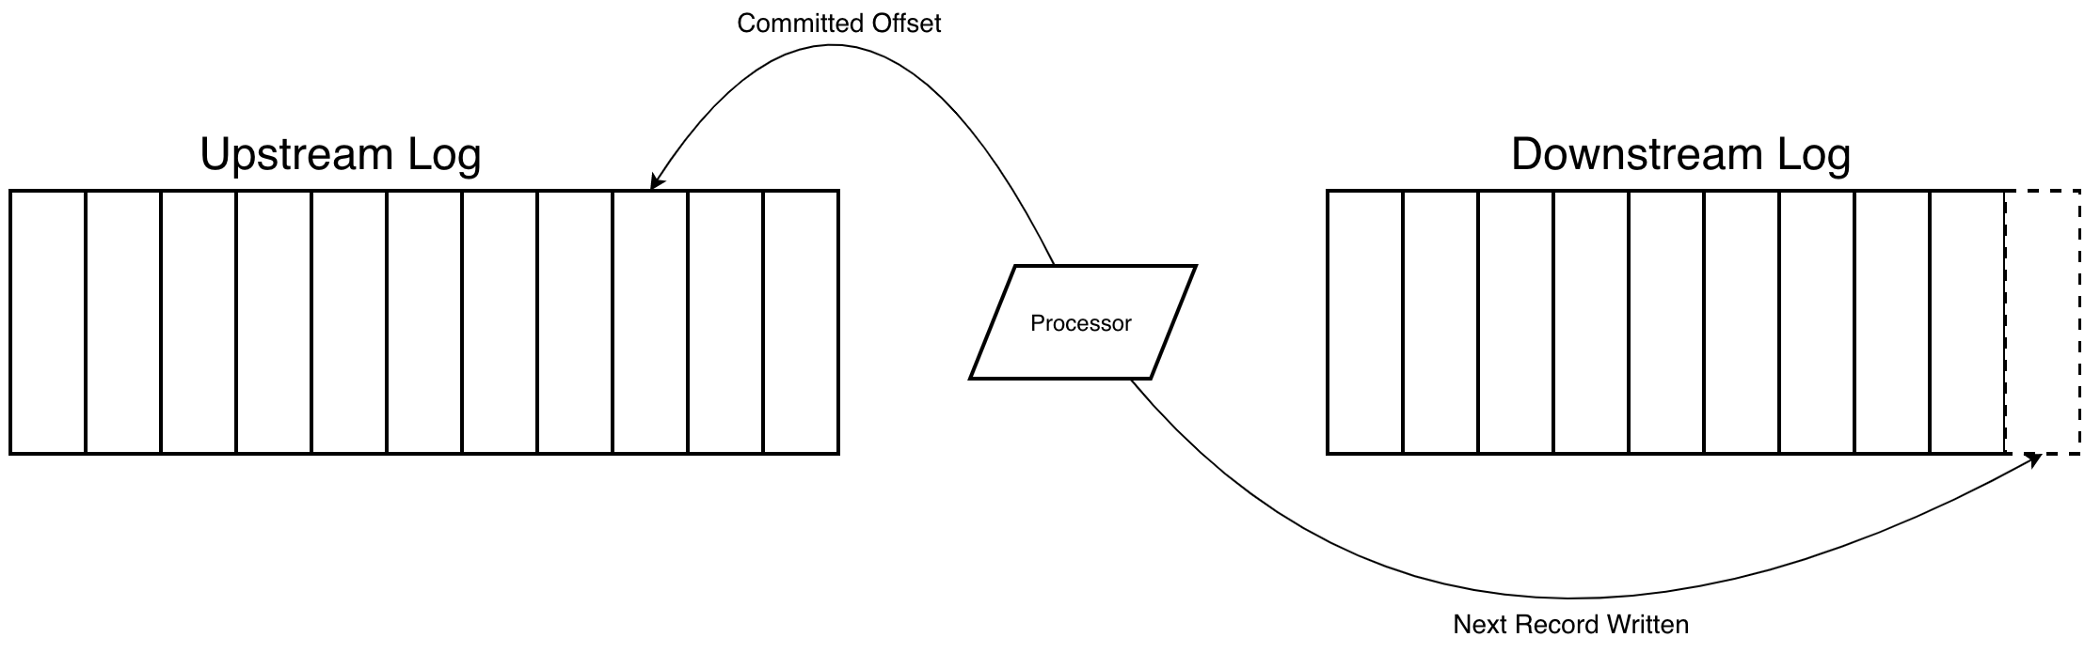
Both of these simple but powerful concepts can be found in each step of the new pipeline we built: as the record for an update travels from Postgres to Kafka to Snowflake, it’s appended to a log at each stop. In conjunction, every consumer maintains an offset in the upstream log as it reads records, and commits a new offset only after it has successfully appended the record to the downstream log. Here’s a quick breakdown of the logs and offsets that make up our new ELT pipeline:
Postgres and Debezium Connector
The Log: The Postgres write ahead log (WAL)
Also referred to as the transaction log, is a log of changes committed to the database. Internally Postgres uses the WAL to ensure data integrity by only changing data files (tables/indexes) after those changes have been logged. In the event of a crash while updating data files, Postgres is able to recover the database using the log. The WAL can also be consumed by external systems through a process called logical decoding which I discussed in the previous section.
The Offset: The Postgres LSN (log sequence number)
The LSN is the byte offset into the Postgres write ahead log. When you create a logical decoding slot, Postgres maintains a variable called confirmed_flush_lsn, which is the latest LSN that its consumer has confirmed it has processed. In our case, the Debezium connector periodically calls PGReplicationStream.setFlushLsn(LogSequenceNumber) to commit its processed offset, but only after it has successfully written the data to Kafka.
Kafka
The Log: Kafka Topics
Logs and offsets are the building blocks of Kafka, and in this case the log is just a Kafka topic. For a good intro, checkout the ‘Kafka in 30 seconds’ section of Kreps’ Kafka Benchmark.
The Offset: As of release 0.9 Kafka has a clever mechanism for allowing its consumers to track and commit their offsets — it uses Kafka!
Internally Kafka maintains a topic called __consumer_offsets which consumers periodically commit their progress to. If the consumer fails, it just requests its last committed offset, and resumes processing where it left off. The frequency at which consumers commit back their offset is configurable, and is a tradeoff between increased overhead for shorter intervals and potentially re-processing more records if the consumer fails for longer intervals.
Streams & Tasks
The Log: Our ‘landing zone’ tables
This is arguably the loosest interpretation of a log as the only thing enforcing the append only property is convention and database permissions. That being said — each table in our landing zone schema has the records read from Kafka appended to it by a Snowpipe. We prevent any inserts/updates/deletes (other than a Snowpipe appending records to the table), which gives us the append only, totally ordered properties of a log.
The Offset: Table Streams
As I mentioned above, Snowflakes new Table Streams feature offers a way to track changes to a table over time. To accomplish this, the Stream maintains a point in time (which they even refer to as an offset in their documentation) as the current transactional version of a table. The offset for a stream is only updated when the contents of the stream are consumed in a successful DML transaction, which means unlike the rest of the pipeline we’re able to guarantee exactly once delivery here. Either the transaction that reads from the stream, inserts/updates/deletes in a new table, and updates the offset succeeds, or it’s rolled back and nothing is changed.
The Result
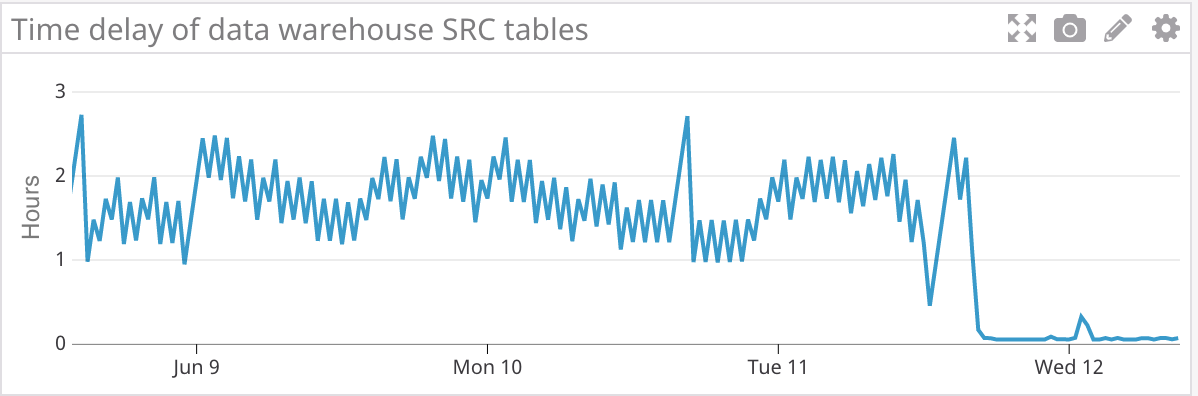
After several months of prototyping and development, we were able to deliver on our goal of a low latency ELT pipeline. I hope this post has illustrated how a relatively complex system can be broken down into a few simple core concepts, a process I had to re-learn as we worked our way through this project. The impact of this project is best summed up by the below graph of data warehouse latency after we transitioned from hourly batch processing to our new ELT pipeline.
Originally published on Convoy Inc's blog and republished here with author's permission. You can read the original article here.
Further reading
