


TL;DR
We benchmarked Diskless Kafka (KIP-1150) with 1 GiB/s in, 3 GiB/s out workload across three AZs. The cluster ran on just six m8g.4xlarge machines, sitting at <30% CPU, delivering ~1.6 seconds P99 end-to-end latency - all while cutting infra spend from ≈$3.32 M a year to under $288k a year. That’s a >94% cloud cost reduction.
Extending Apache Kafka® does come with an explicit tax. At this load, metadata operations together generate about 1.4 MiB/s of cross-AZ traffic, which translates to $7,803 a year. In exchange, Diskless removes $3,088,272 a year of cross-AZ replication costs and $222,576 a year of disk spend from an equivalent three-AZ, RF=3 Kafka deployment.
This post is the first in a new series aimed at helping practitioners build real conviction in object-storage-first streaming for Apache Kafka. We’ll look at the performance of Kafka from first principles, diving into: stability, resource consumption, TCO, and external dependencies like the Diskless Coordinator and S3. The benchmark workload comfortably covers 99% of Kafka deployments, and we do it in the open.
You don’t have to take our word for it: we’ve published the exact OMB configs, and service plans so you can reproduce or tweak the benchmarks yourself and see if the numbers hold in your own cloud.
We also published the raw results in our dedicated repository wiki.
Benchmarks are Dead. Long Live benchmarks.
Benchmarks are a terrible way to evaluate a streaming engine.
They’re fragile, easy to game, and full of invisible assumptions. But we still need them.
If we were in the business of selling magic boxes, this is where we’d tell you that Aiven’s Kafka, powered by Diskless topics (KIP-1150), has “10x the elasticity and is 10x cheaper” than classic Kafka and all you pay is “1 second extra latency”.
We’re not going to do that.
Diskless topics are an upgrade to Apache Kafka, not a replacement, and our plan has always been:
- Save costs: Offer Apache Kafka practitioners a way to eliminate disks and cross-zone networking costs by introducing a direct-to-S3 topic primitive.
- Extend Kafka, don’t fork it: let users run classic and Diskless topics side by side on the same cluster.
- Work in the open: meet the bar for upstream quality and standardization and ship it via KIP-1150.
- Invest for the decade: evolve Kafka so it stays competitive in the cloud for the next 10 years, not just the next few quarters.
At Aiven, we’re already using Diskless Kafka to cut our own infrastructure bill and pass those savings on to customers. That’s the easy part. The harder part is demonstrating how it behaves under load in a way that seasoned operators and engineers trust.
That’s why we chose to publish benchmarks that are both realistic and open-source:
- Realistic: shaped around workloads people actually run, not a lab puzzle built to manufacture a headline.
- Open-source: it’d be ridiculous to prove an open source platform via proprietary tests
With these benchmarks the community has a solid data point when thinking about Diskless topics’ performance in Apache Kafka - a starting point you can poke, break, and improve.
Constructing a realistic Benchmark
We executed the tests on Aiven which runs Diskless (Apache Kafka 4.0).
The benchmark had to be fair, hard and reproducible:
- We rejected reviewing scenarios that flatter Diskless by design. Benchmark crimes such as single-AZ setups with a 100% cache hit rate, toy workloads with a 1:1 fan-out or things that are easy to game like the compression genie randomBytesRatio were avoided.
- We use the Inkless implementation of KIP-1150 Diskless topics Revision 1, the original design (which is currently under discussion). The design is actively evolving - future upgrades will get even better performance. Think of these results as the baseline.
- We anchored everything on: uncompressed 1 GB/s in and 3 GB/s out across three availability zones. That’s the kind of high-throughput, fan-out-heavy pattern that covers the vast majority of serious Kafka deployments. Coincidentally these high-volume workloads are usually the least latency sensitive and can benefit the most from Diskless.
- Critically, we chose uncompressed throughput so that we don’t need to engage in tests that depend on the (often subjective) compression ratio. A compressed 1 GiB workload can be 2 GiB/s, 5 GiB/s, 10 GiB/s uncompressed. An uncompressed 1 GiB/s workload is 1 GiB/s. They both measure the same thing, but can lead to different “cost saving comparison” conclusions.
- We kept the software as comparable as possible. The benchmarks run against our Inkless repo of Apache Kafka, based on version 4.0. The fork contains minimal changes: essentially, it adds the Diskless paths while leaving the classic path untouched. Diskless topics are just another topic type in the same cluster.
In other words, we’re not comparing a lab POC to a production system. We’re comparing production Diskless topics to classic, replicated Apache Kafka under a very real, very demanding 3-AZ baseline: 1 GB/s in, 3 GB/s out.
Testing Diskless Topics
We are using the industry standard OpenMessaging Benchmark (OMB) framework to execute the workloads against Kafka services running on Aiven. Three of the nodes are producers (one per zone), and six are consumers (two per zone).
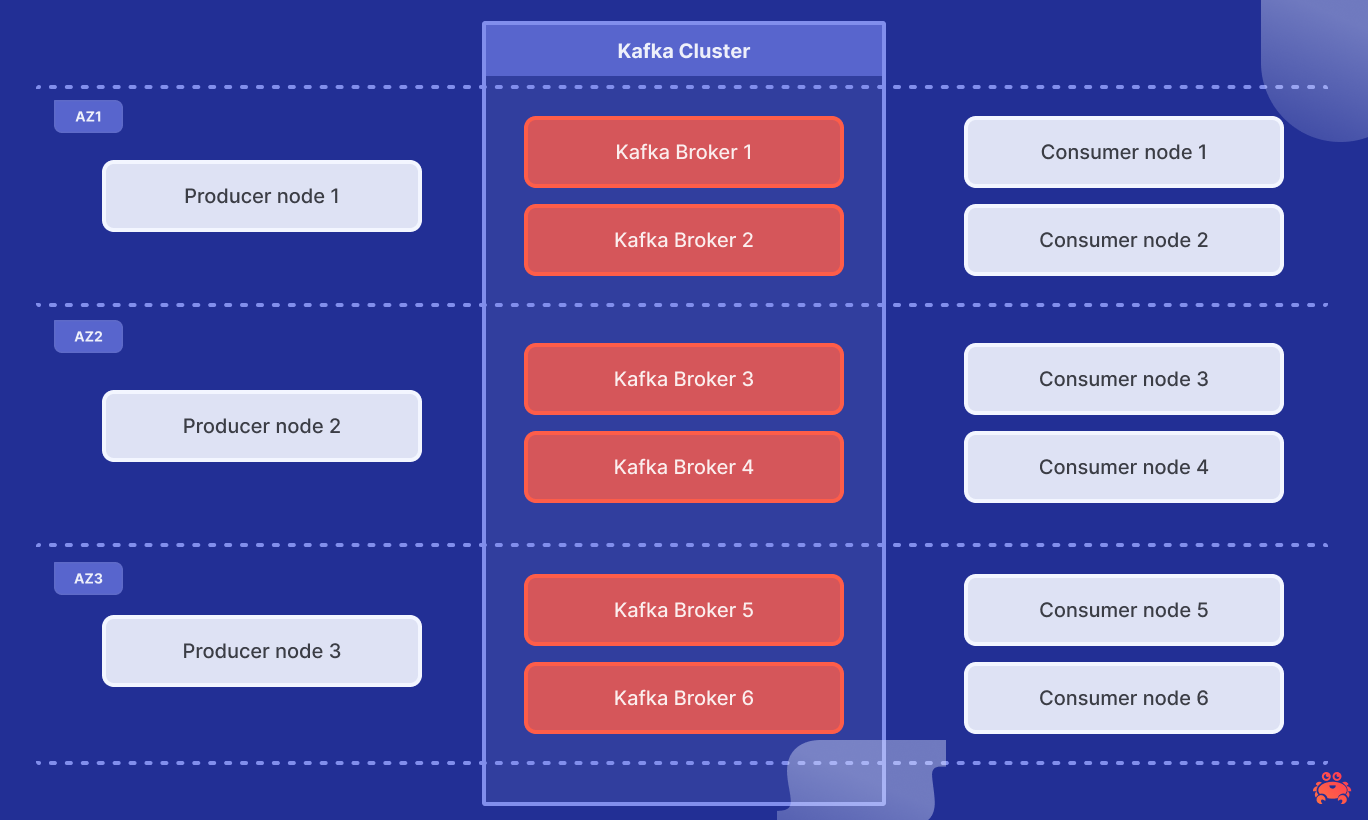
The Inkless Kafka cluster is fully managed and running on Aiven, using 6 m8g.4xlarge with 16 vCPUs and 64 GiB memory.
To run the benchmark yourself you can create an identical service by running the following:
Loading code...
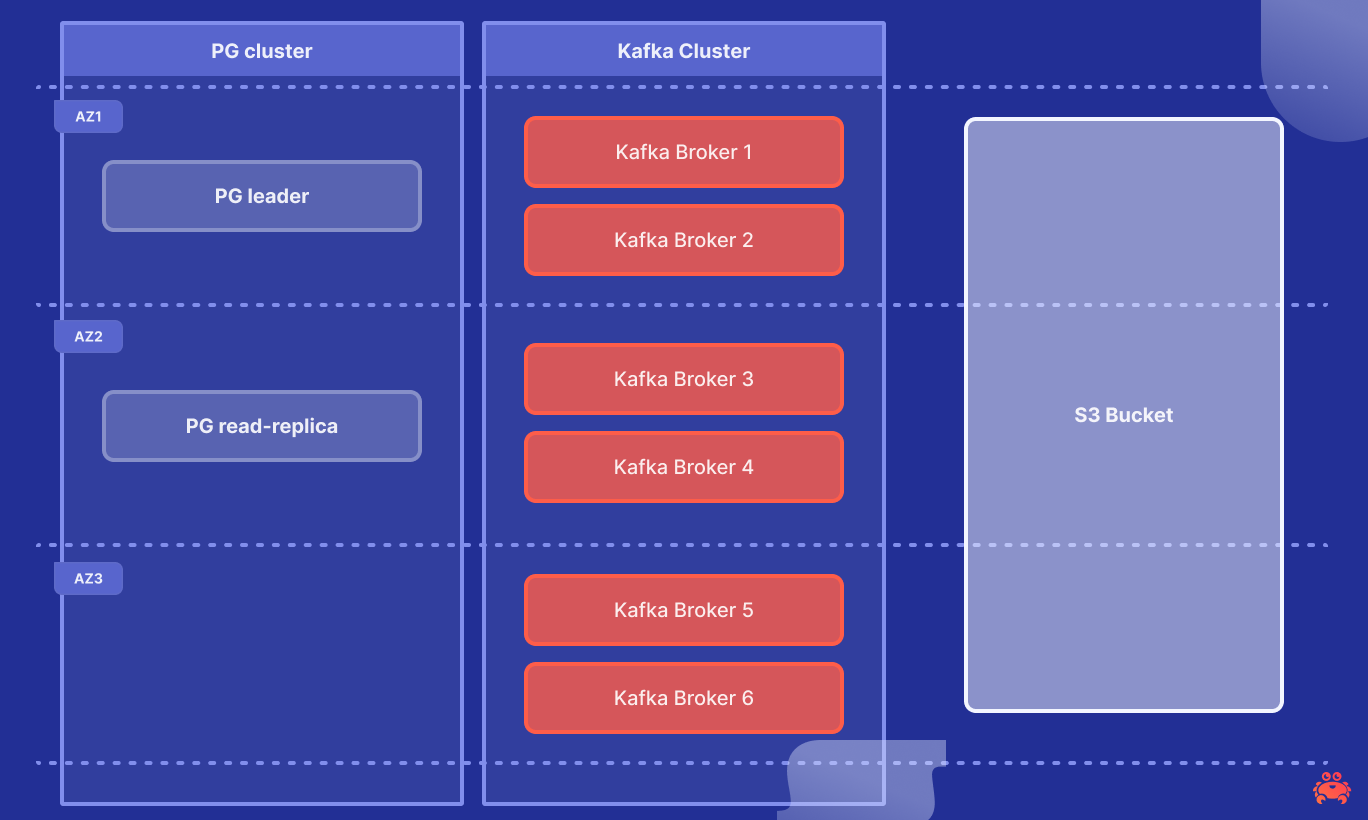
Diskless topics rely on a lightweight but strongly consistent metadata store. We back the Diskless Batch Coordinator with Aiven for PostgreSQL. We are very fortunate that Aiven runs more than 150 thousand managed PostgreSQL databases, operated by a team of world‑class Postgres committers. For this test, we used a dual‑AZ PostgreSQL service on i3.2xlarge with local 1.9TB NVMe to power the Coordinator.
The OMB workload has an hour-long test of 1GiB/s consumed in parallel by 3 consumer groups. It uses 1 topic with 576 partitions, with 144 producer and 144 consumer clients. On average, each producer gets 4 partitions, optimizing client instances for higher concurrency. See the full fanout configuration here and the client configuration here.
We ensured that the producers and consumers are not the bottleneck and optimised them for throughput with:
- linger.ms of 100ms to batch 1MiB of batch.size data per partition, up to 4MiB max.request.size per broker.
- Consumers fetch.max.bytes is up to 64MB (up to 8MB per partition) with a timeout of 500ms with a minimum size of 4MiB.
- To avoid producer bottlenecks, all the traffic will be *uncompressed from producers to consumers and on S3 storage
*In real workloads you should expect significantly lower storage and network costs thanks to producer compression. A typical Kafka deployment sees 4–5× compression, which proportionally reduces the number of bytes written to and read from object storage.
To run the benchmark yourself, connect to one of the workers and execute:
Loading code...
Note the -x flag is set to increase the number of consumer workers to ⅔ of the available workers, 3 producers and 6 consumers workers in this case.
Exploring the Results
We use Aiven BYOC as the cloud platform running the latest build from the Inkless repo with no other modifications or tuning.
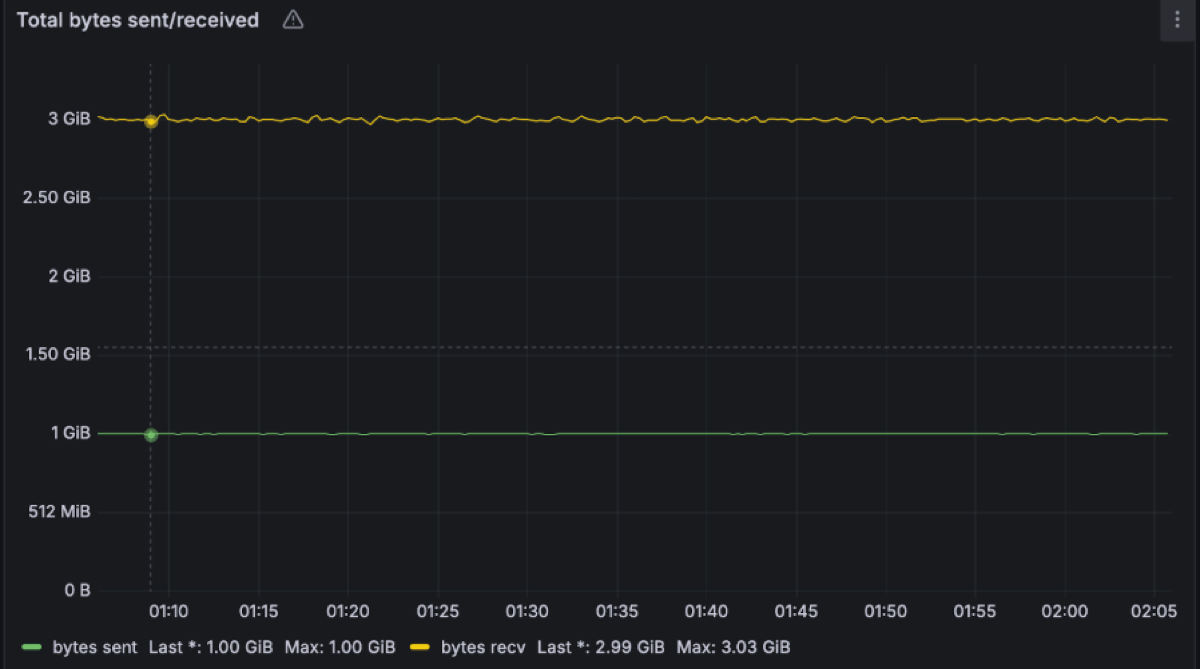
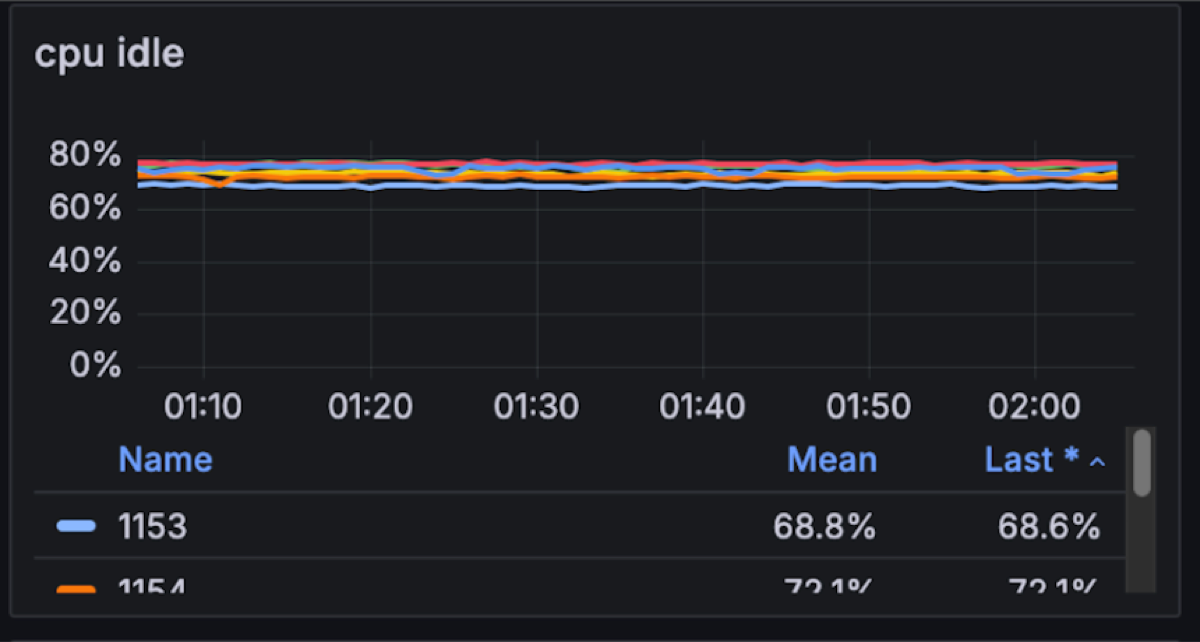
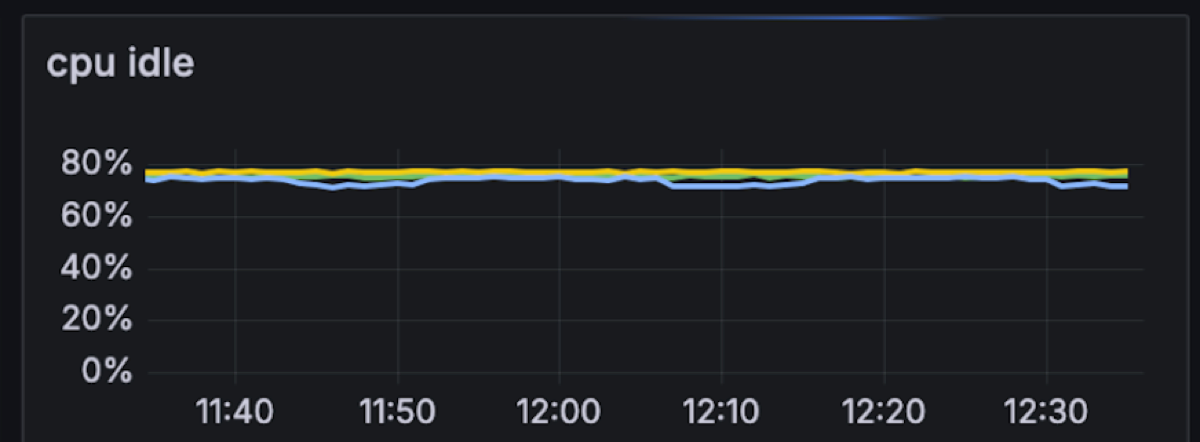
Unsurprisingly the 3AZ 1 GB/s in and 3 GB/s out was stable. The cluster had just 30% CPU utilization. We suspect this particular set-up can maintain at least 2x-3x the throughput, which is extremely efficient vs. Apache Kafka (in future blog posts we will try to break it and dig deeper into failure modes). For comparison, a similar workload is best served by 9 or more Kafka brokers with at least 20% more compute vs. Diskless.
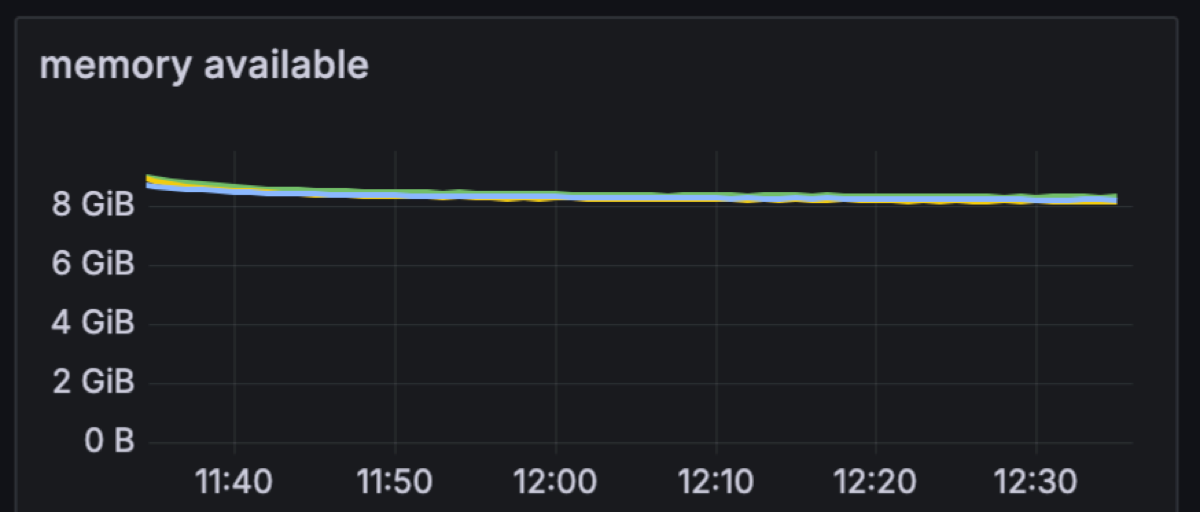
The memory profile for Diskless topics is different from classic: because files are not stored on local disks, Linux page cache cannot be leveraged. Instead, Diskless topics use an on‑heap cache to keep the most recent batches in memory. That can make it look as if Kafka is hogging RAM, but in practice it’s just caching data for fast and cost‑efficient access instead of having to issue extra GETs to S3. Looking ahead, we’re finishing a proposal to bring the page cache back into the picture for Diskless workloads, so future iterations will combine the cost savings of object storage with the scalability characteristics operators expect from classic Kafka.
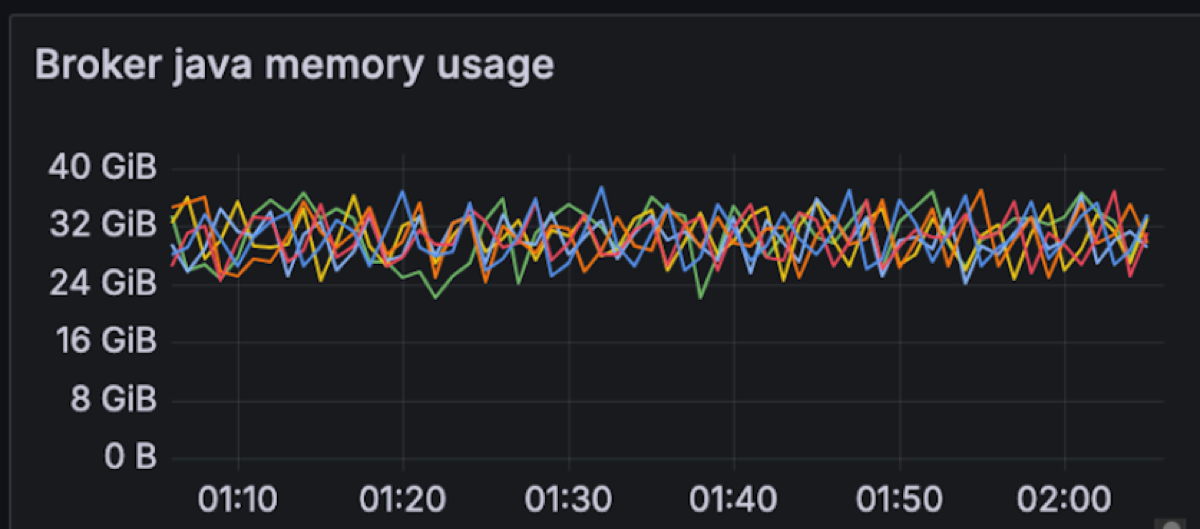
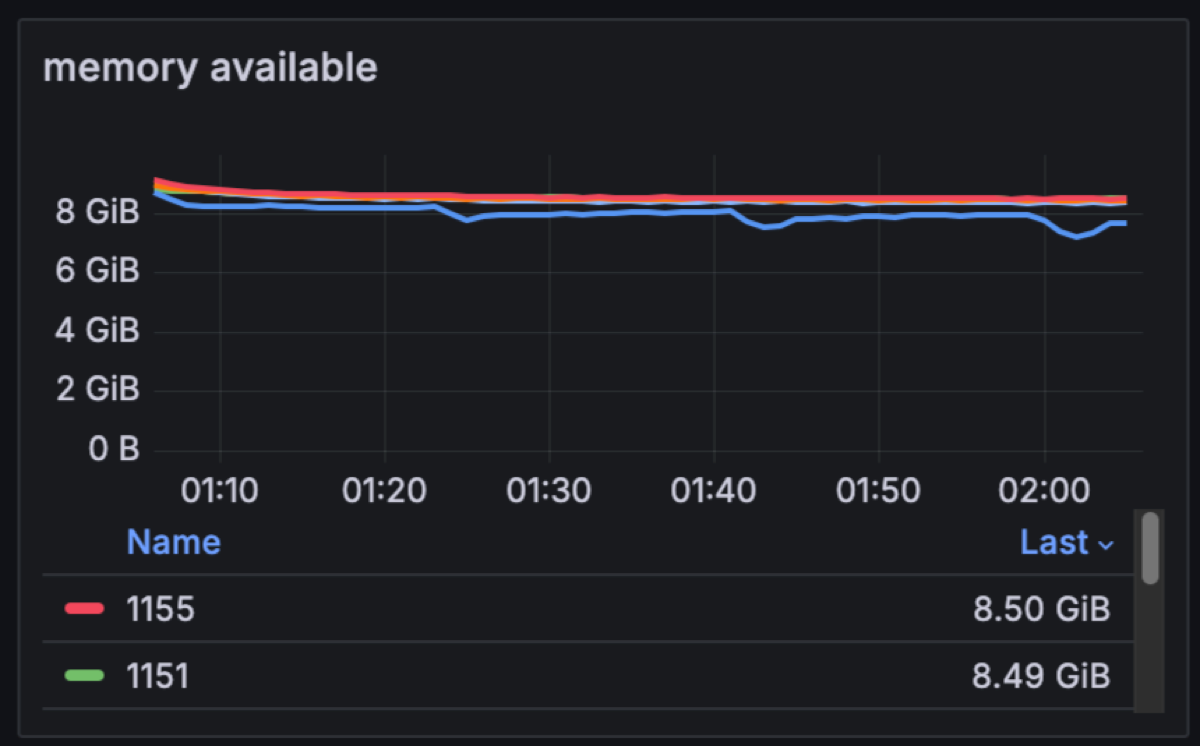
In a classic Kafka setup, brokers are assigned 4-8GB of JVM heap size, but for Diskless this needs to be increased. We are changing this memory allocation to consume ~75% of the available memory per broker for Kafka (48GB) for the JVM heap. This will be shared between Kafka internals and Diskless caches. In this particular test we have 8GBs of memory free for classic and internal topics.
With Diskless we made the intentional choice to keep Kafka… Kafka. We didn’t fork the protocol or split “cheap Kafka” into a different product. As classic topics and Diskless topics run side-by-side in the same cluster, Inkless leans on Kafka’s existing internal topics for consumer groups, offsets and coordination instead of reinventing them.
That does mean there’s still some tiny amount of cross-AZ traffic: on this benchmark, Kafka’s internal topics replicate at about 1.4 MB/s with a typical RF=3, and consumers issue roughly 1.1k offset-commit requests per broker per second. In practice, that’s ~3.6 TB a month of cross-AZ replication to keep Apache Kafka semantics alive. Even if you pessimistically price that at $0.2/GB, it works out to roughly $655/month at list price: a rounding error compared to $257,356/month cross-AZ and $18,548 disk bill that Diskless removes.
It’s worth noting that KIP-1150 intentionally trades away Kafka’s traditional reliance on local page cache, and there is active discussion in the community (see the KIP-1176 vs KIP-1150 comparison) about how much of that caching behaviour should be re-introduced in future iterations without giving up the Diskless cost model; the Inkless repo tracks this work closely and will evolve with the upstream design.
Now back to the serious test. As expected the main trade-off in making Kafka 10x cheaper and more stateless is that your latency increases. We wanted to precisely measure the end-to-end latencies.
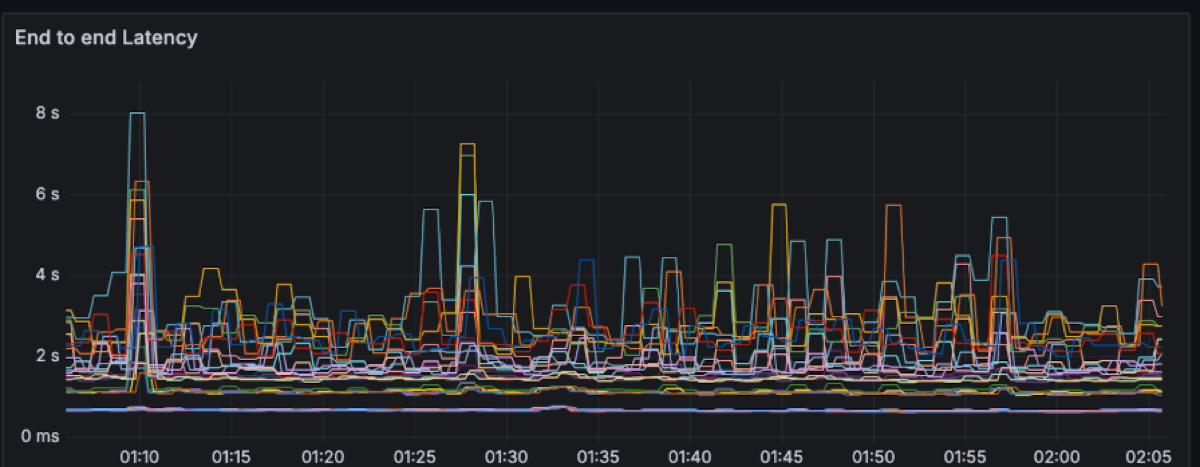
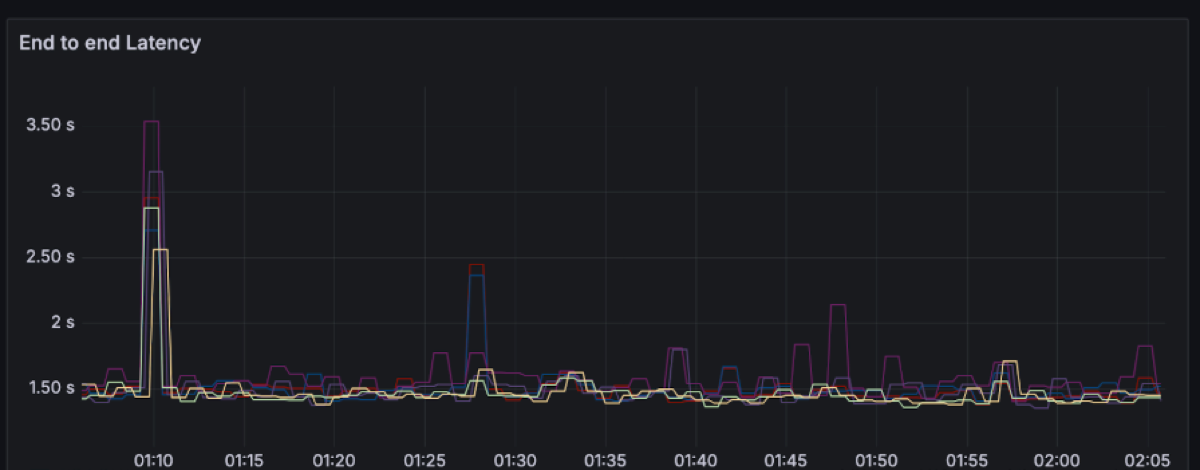
End-to-end latency is measured on the client side: from the moment a producer sends a record until a consumer in a group successfully reads it. With Diskless topics, that path always includes an object-storage hop, so the behaviour of a multi-tenant system like S3 inevitably shows up in the tail: most requests land in a tight band, but occasional spikes are expected.
Each line on the latency charts represents a single OMB worker node (i.e. a distinct node running multiple clients e.g. 48 producers/72 consumers). For each of those we plotted the full latency spectrum (P50, P99, P999 and the max) rather than just the flattering P50/P99 line. That’s why you see a handful of points stretching out to several seconds, even though the bulk of the traffic sits around ~650 ms P50 and ~1.5 s P99.
We could have made the graphs look much “nicer” by filtering to the best-behaved AZ, aggregating across workers, truncating the y-axis, or simply hiding everything beyond P99. Instead, we avoided committing benchmark crimes by smoothing the graph and chose to show the raw recordings per worker. The result is a more honest picture: you see both the steady-state behaviour and the rare S3-driven outliers, and you can decide for yourself whether that latency profile matches your workload’s needs.
For this workload, the end-to-end latency has a spectrum between ~200 to ~600ms with momentary spikes up to 8 seconds.
P50: ~650ms with spikes up to 750ms
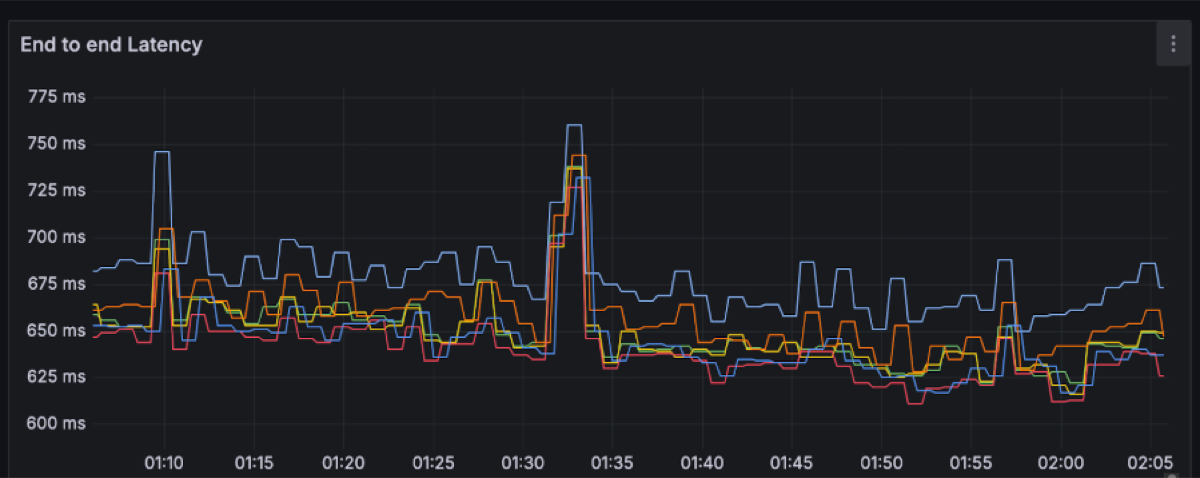
P99: ~1.5s with spikes up to 3.5s
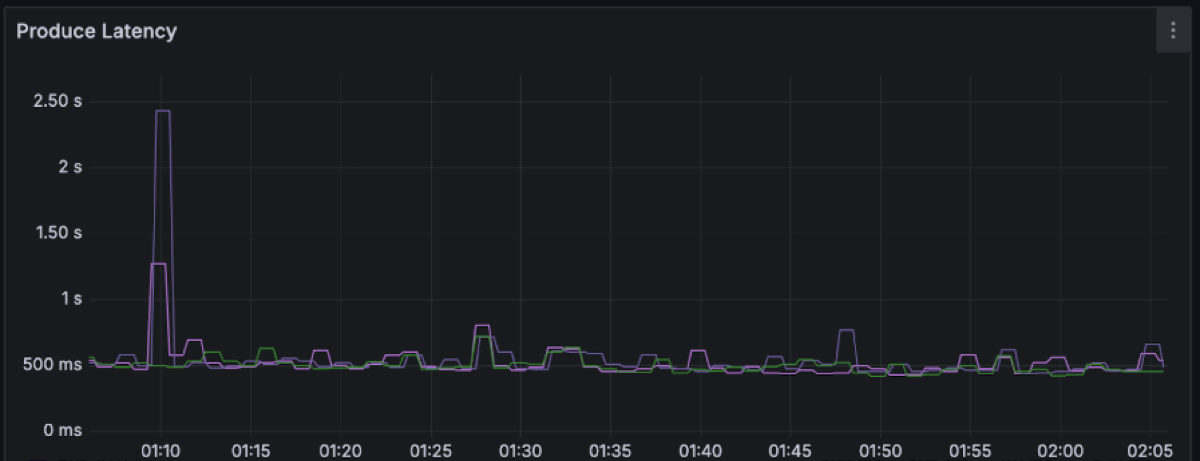
Produce latency drives the overall latency with percentiles between 250ms and 1s, with several spikes along the way up to 4s.
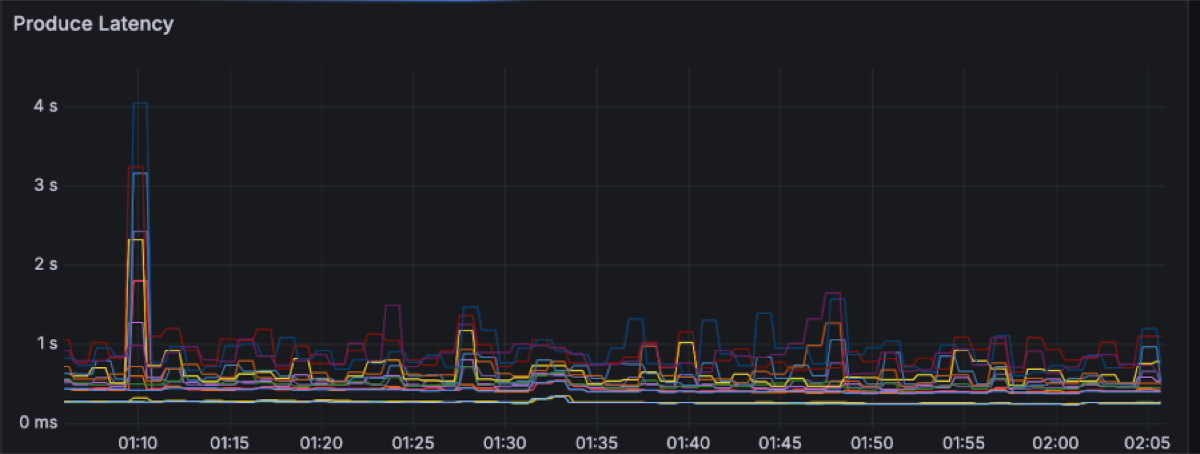
P50: ~250ms with spikes up to 350ms
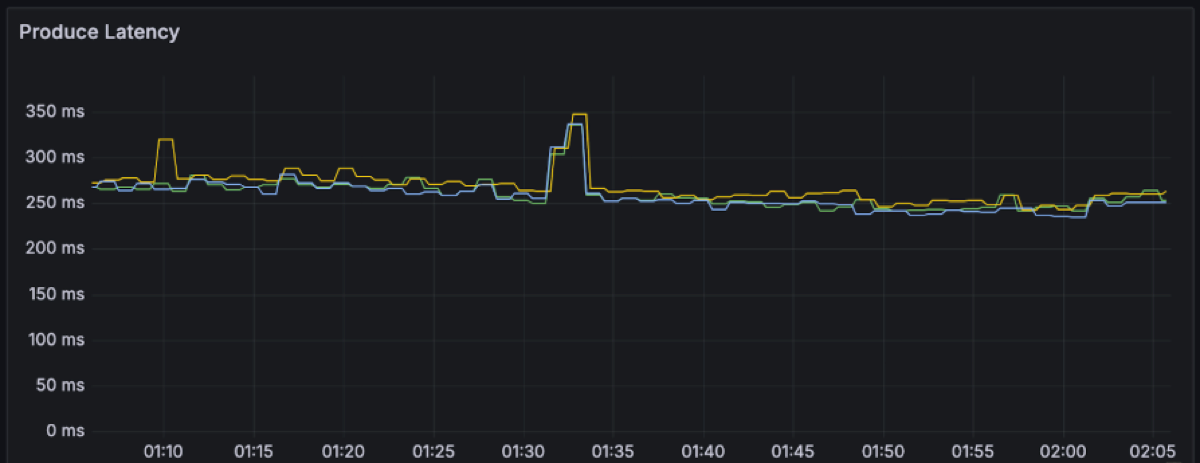
P99: ~500ms with spikes up to 2.5s
This is what the clients see. Let’s move into the broker side and explore the latencies there. We expected object storage operations to be the main drivers of latency. Regular S3 PUT and GET requests can be expected to take a few hundreds of milliseconds. For instance these are the upload and fetch file latencies for this workload, respectively measuring the time it takes for PUT/GET operations to complete:
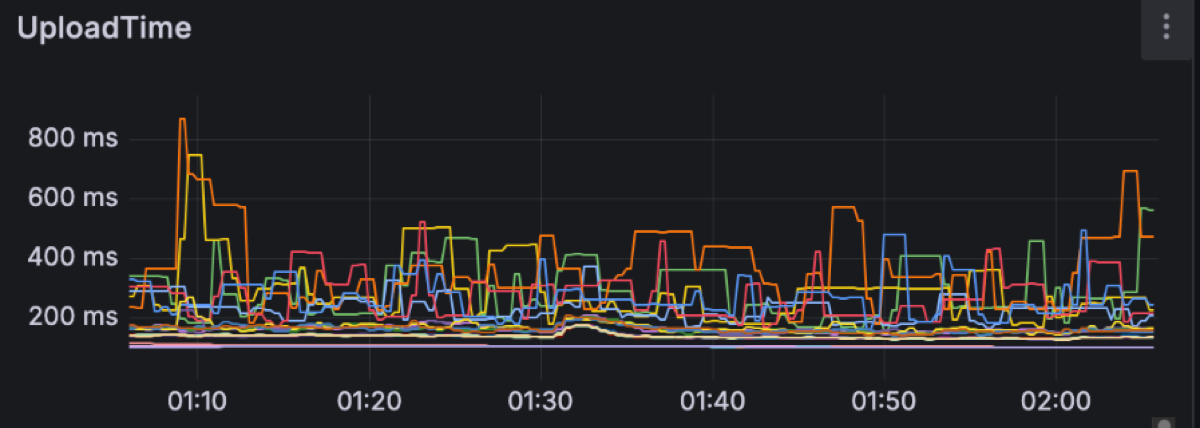
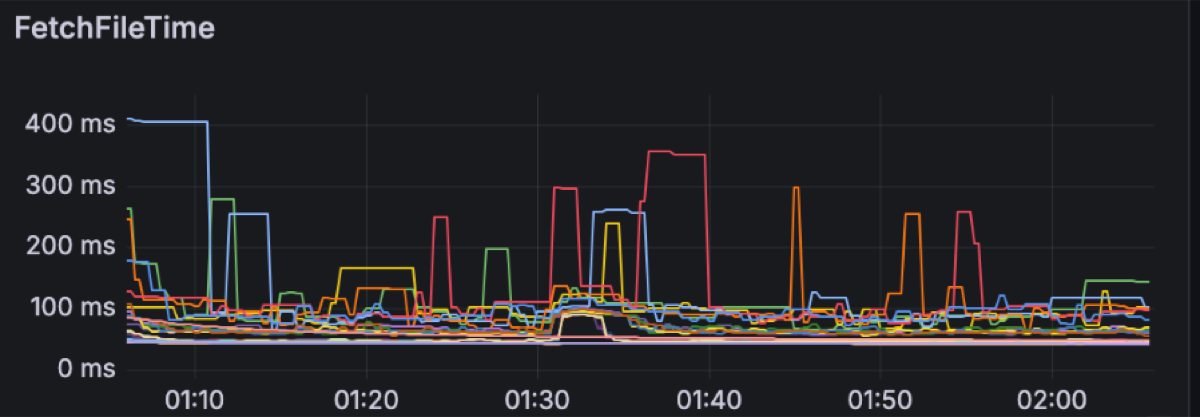
S3 latency is an ongoing area of research as its latency is not always predictable. For instance, having warm-up time helps S3 build up the capacity to match an increasing load. Increasing concurrency, e.g. by having more brokers on the same zone, leads to more predictable performance as well. Having the right size of files to upload also impacts S3 performance. We are currently using a 4MiB file size limit, as we have found larger files to increase spikes on S3 PUT latency.
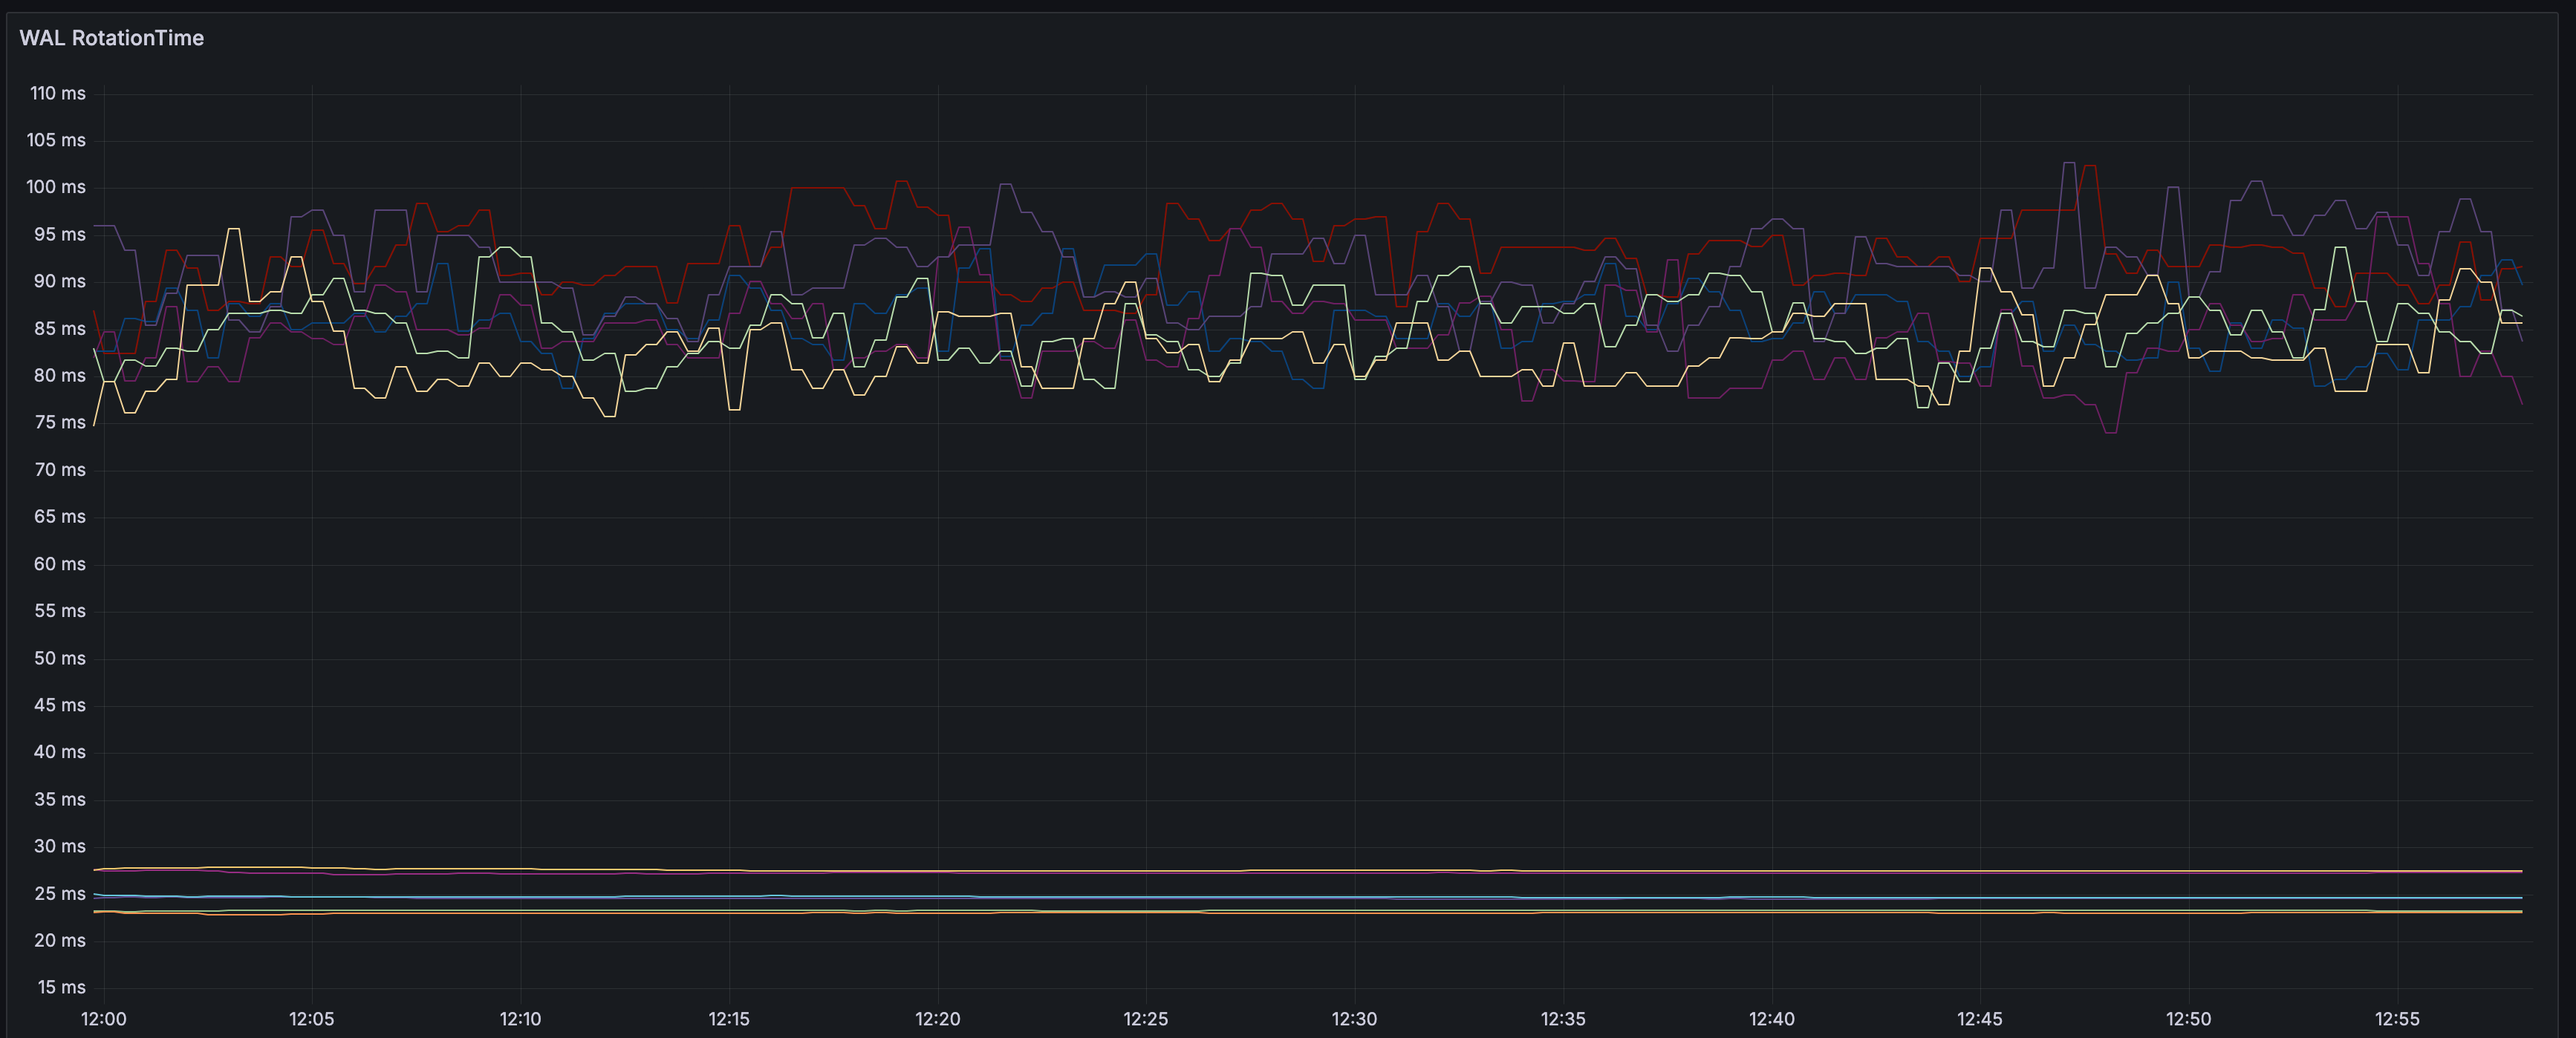
Having enough producer concurrency helps to build the Diskless files faster too. By default, the buffer timeout is 250ms; but if enough requests are received to hit the 4MiB limit, then files can be uploaded faster, reducing the latency.
For instance, on a similar execution, the rotation latency is between 65ms and 85ms P99.
S3 usage is as follows:
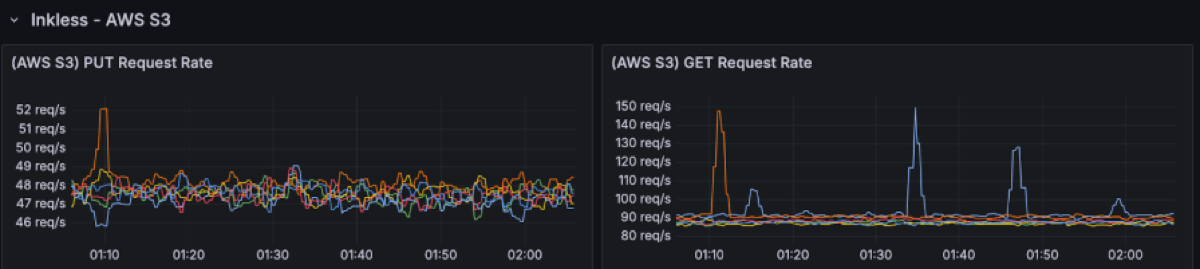
There are ~50 PUT rps per broker (~300rps in total). The GET request rate is 2 times the PUT requests as uploaded files are cached in the availability zone they get uploaded from, but have to be fetched from the other two availability zones.
The S3 storage is 3600 GiB: 1 hour worth of data at 1GiB/s.
A critical element of Diskless is the Coordinator’s performance. When a broker uploads a mixed file segment to S3, it commits it to the coordinator. These commits happen serially per broker. If the coordinator were to take a long time with one request, it would result in head of line blocking which slows down every other request that was waiting on its turn. Having CommitFile latencies below 100ms has shown criticality to keep performance predictable.
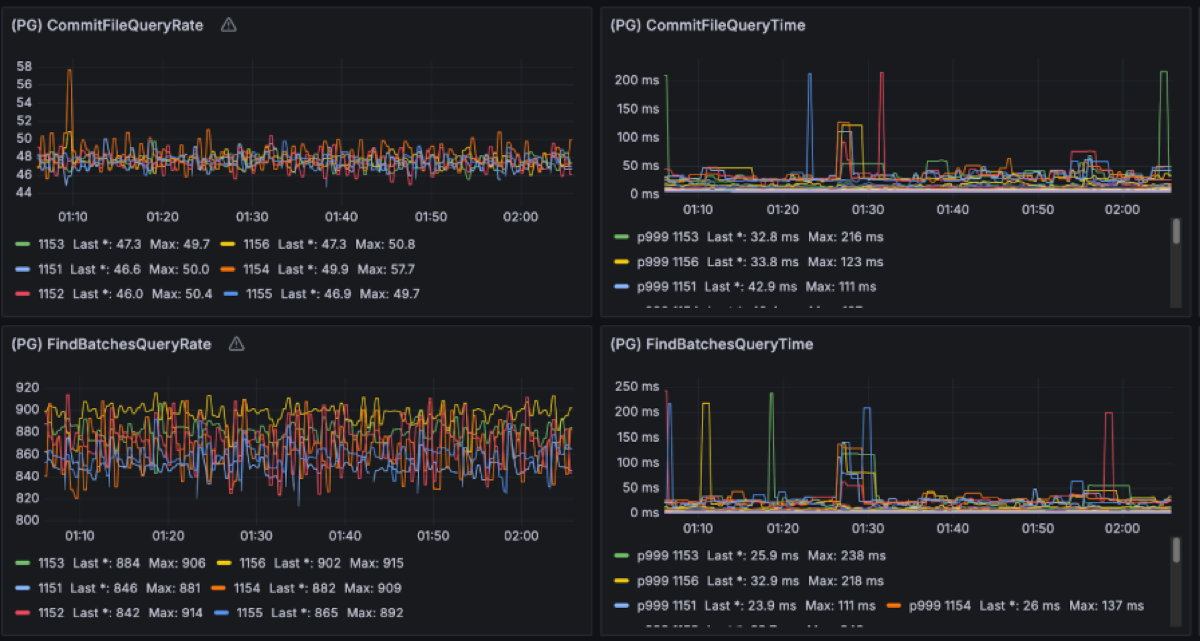
In this benchmark we extensively studied the coordinator traffic as it contributes to the cross-zones networking cost too. Given the 1GiB/s of ingress producer data, we have observed ~1MiB/s of metadata writes into PG and ~1.5MiB/s of queries traffic out. As the PG leader is placed on a single zone, ⅔ of that client traffic comes from brokers in other AZs. This translates to approximately 1.67MiB/s of cross-AZ traffic for metadata operations.
On top of that, PostgreSQL replicates the uncompressed WAL across AZs from the primary to the replica node for durability. In this benchmark, the WAL stream runs at about 10 MiB/s, i.e. roughly a 10× write-amplification over the ~1 MiB/s of logical metadata writes we see from the brokers. That may look high if you come from the Kafka side, but it’s typical for PostgreSQL once you account for indexes, MVCC bookkeeping and the fact that WAL is not compressed. If you add the ~1 MiB/s of metadata writes and ~4 MiB/s of reads that brokers issue to the coordinator, you end up with on the order of 12–13 MiB/s of coordinator-related traffic in total. Against the 4 GiB/s Kafka data plane, that’s 0.3% of throughput and roughly $6 k/year in cross-AZ charges at $0.02/GB: a rounding error compared to the >$3.2 M/year cross-AZ and disk bill a classic 3-AZ, RF=3 Kafka deployment would incur for the same 1 GiB/s workload. Whether you run PostgreSQL yourself or consume it as a managed service (such as Aiven for PostgreSQL), this traffic volume stays tiny relative to the stream. The point is that the metadata layer is deliberately lightweight and the expensive part of the bill is no longer “Kafka replicating disks across zones”.
Conclusion
In our testing, Diskless did exactly what it says on the tin: we paid roughly a second of extra latency and got almost 90% of the Kafka cost back. At today’s cloud prices this architecture positions Kafka in an entirely different category, opening the door for the next generation of streaming platforms.
| Diskless | |
|---|---|
| Savings | >94% |
| End to end Latency | P50 is ~650ms, P99 is ~1.5s S3 Standard |
| Produce Latency | P50 is ~250ms, P99 is ~500ms |
| Compute | 6 brokers with 16 vCPUs and 64 GiB memory, CPU utilization: ~30% |
| Storage | 3600 GB stored cluster-wide on AWS S3 per hour ~50 PUT requests/sec. per broker, ~1M PUT requests per hour per cluster ~100 GET requests/sec. per broker, ~2M GET requests per hour per cluster |
| Cross-AZ Traffic for Internal Topic Replication | ~1.4MiB/s replication of Kafka internal topics. Consumers commit 1.14K req/s per broker. |
| Cross-AZ Traffic for Postgres Replication | ⅔ of the Postgres client traffic crosses zones: ~0.6MB/s in and ~2.6MB/s out Primary-standby WAL replication also crosses zones: ~10MB/s. |
| Cross-AZ Traffic for Clients | 0 MB/s |
The timing for this benchmark is good. The community is already leaning toward Diskless architectures. Meanwhile, we are having serious conversations with committers and vendors on the best path forward. Apache Kafka is shared turf so if you want to have a say in how Diskless topics land in Kafka, jump into the KIP-1150 threads on the Kafka mailing list.
In part two, we’ll make things more interesting and inject severe failures and challenges in production: node sabotage, mixed clusters serving both Diskless and Classic, speed of scaling up and down, blowing up partition counts, awkward producer/consumer patterns, and other edge cases that tend to break Apache Kafka in the real-world.
Bonus Benchmarks
For fun we decided to see what Diskless can do on 50% less compute (3 nodes) in single-AZ and no fan-out, a design that favors such architecture as reads are the most taxing on compute. Turns out in such a scenario Diskless barely nudged the per node resource consumption, compared to a Kafka cluster (which typically needs 9 nodes for this) it is 69% less compute in total.
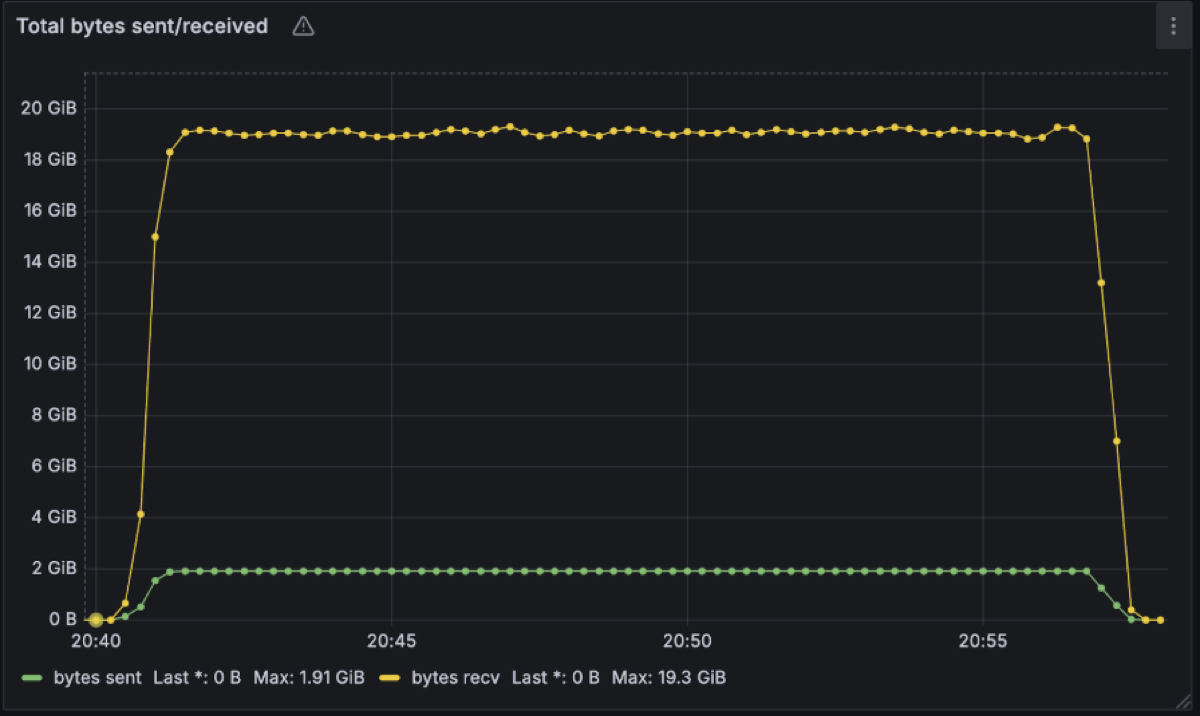
From an onboarding customer with very high read fanout, we have Diskless topics work at 2GB/s in and 19.3GB/s out on a single cluster again with similar utilisation posture.
So the real question isn’t “can Diskless handle real workloads?” it’s “where in your architecture are you willing to trade ~1s of latency for 90% cheaper Kafka, and why haven’t you tried it yet?”
