



TL;DR
Route security events through Kafka to their own index or cluster, with longer retention and tighter access than operations logs. Map their fields to a Security Analytics log type, since field mapping decides whether rules fire. Run detectors with prepackaged Sigma rules, correlate findings across log sources, and scan the same indexes for threat-intelligence indicators. Then turn on audit logging so the observability cluster itself is watched too.
A security information and event management (SIEM) system watches security events continuously and raises a finding the moment a pattern matches. Operations teams usually search the same events only after an incident. Some of those events are already in the pipeline from post 2 on centralizing logs. Host authentication logs and web server access logs come in through the same log forwarders as application logs. Other sources, such as firewalls, DNS resolvers and cloud audit trails, usually sit outside the application hosts, but they can feed the same Apache Kafka® cluster once you add a forwarder or connector for each one.
The gap between searching and watching is not storage, since you already store the events. It is detection and correlation: normalizing events to a known schema, running rules against them as they arrive, and joining findings from different sources into one incident. OpenSearch® ships those pieces in the Security Analytics plugin, so this post covers how to add a detection layer on top of the pipeline you already run, where the real effort goes, and where OpenSearch stops.
What a SIEM needs from a log platform
A SIEM does a short list of jobs, and OpenSearch has a component for most of them. Collection and buffering are already done if you followed post 2. The remaining jobs sit inside the cluster: Security Analytics normalizes, detects, correlates and enriches, the Alerting and Notifications plugins send the result out, and the usual search tools cover investigation.
| SIEM job | OpenSearch component | Notes |
|---|---|---|
| Collect and buffer | OpenTelemetry Collector or Fluent Bit, Kafka, Kafka Connect sink | The pipeline from post 2 |
| Normalize | Pipeline transforms, Security Analytics field mappings | Where most of the effort goes |
| Detect | Security Analytics detectors, Sigma rules | Prepackaged and custom rules |
| Correlate | Correlation rules, correlation graph | Findings joined within a time window |
| Enrich | Threat intelligence sources and scan configurations | Default AlienVault IP reputation feed |
| Alert | Alerting composite monitors, Notifications | Slack, PagerDuty, email, webhooks |
| Investigate and retain | Discover, PPL, Notebooks, Index State Management, searchable snapshots | Tiering in post 5 |
| Respond and manage cases | Not covered | Hand off to SOAR or ticketing |
The last row matters. OpenSearch has no case management and no automated response, which is the territory of security orchestration, automation and response (SOAR) tools. Alerts leave the cluster through Notifications, and the tool on the other end owns the ticket, the runbook and the remediation. That split is a reasonable one, since a team that already has a ticketing or SOAR tool may not want to replace it.
The OpenSearch blog's SIEM overview describes what each of these features does, and it is candid that OpenSearch is not as plug-and-play as a packaged SIEM. Packaged SIEMs have their own costs, though. They are often priced by the volume of data they ingest, and they bundle case management, behavior analytics and automated response that a team with an existing ticketing tool may never use. If what you need is detection, correlation and a searchable audit trail, running it on OpenSearch alongside your operational logs can be the better fit. The rest of this post covers where that extra effort goes, starting with the pipeline.
Routing security events
Post 2 made the case for putting Kafka between log forwarders and OpenSearch, so that a routing change is pipeline configuration rather than a redeploy. Security events are a common first candidate for a route of their own. Authentication, firewall, DNS and cloud audit events go to their own Kafka topics, and a dedicated Kafka Connect sink writes them to their own security indexes. Those indexes can sit on the same OpenSearch cluster as your other logs, with a separate cluster as an option when you need stricter isolation. Application and infrastructure logs keep their existing route.
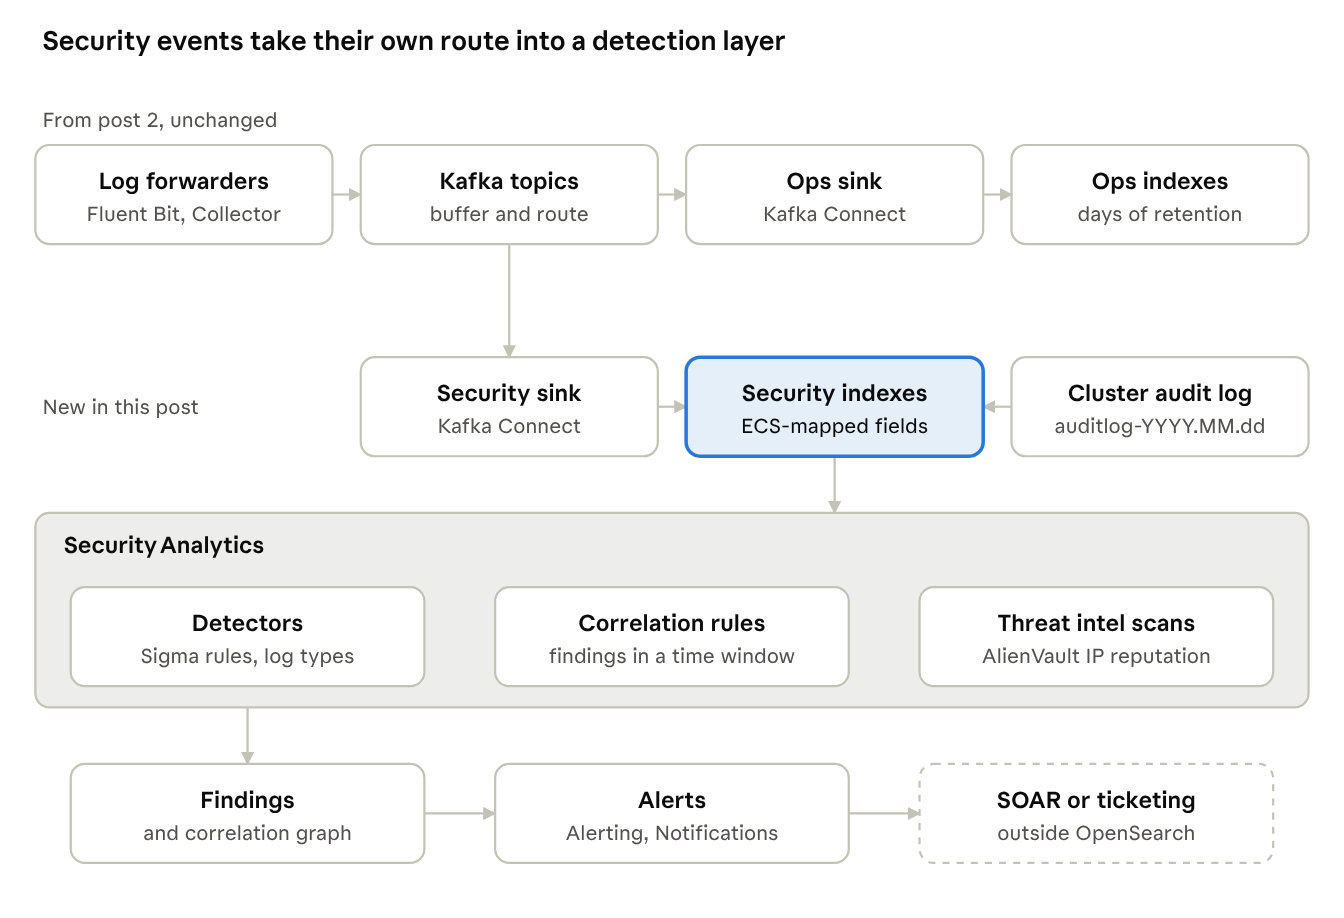
The top row is the pipeline from post 2, unchanged. Everything below Kafka is new, with the security indexes as the pivot between the pipeline and the detection layer.
There are four reasons to separate them.
- Retention. Compliance asks for months or years of security events, while operations logs are useful for days. Kafka buffers events but isn't searchable, so the window analysts search lives in OpenSearch: hot nodes for recent events, warm nodes for older ones, and searchable snapshots in object storage for the compliance tail, all queryable. Post 5 will cover the mechanics. Use one retention method per index, because when an index retention pattern and the log integration's retention both apply, the smaller value wins.
- Access. Role-based access control with document- and field-level security keeps application teams out of authentication logs. On Aiven for OpenSearch, filtering alerts by backend role (
plugins_alerting_filter_by_backend_roles) keeps security alerts with the security team. - Isolation. A noisy application that floods its own indexes should not slow detection, and if it does, moving the security indexes to their own cluster lets you size it for their query pattern.
- Normalization. The security route is the place to map events to Elastic Common Schema (ECS) field names, in the pipeline rather than after indexing. Field mapping decides whether rules fire, which the next section shows. Aiven's own guidance points the same way: use explicit mappings in production rather than dynamic mapping.
Normalizing in the pipeline also pays off for retention, since every event in the compliance tail already has the field names your rules expect.
Detecting threats with Security Analytics
Security Analytics is built from four parts: log types, rules, detectors and findings. A log type describes a source and its fields. A rule is a Sigma rule mapped to MITRE ATT&CK, and OpenSearch ships more than 2,200 of them prepackaged. A detector runs a set of rules against an index on a schedule. A finding records each document that matched a rule.
The standard log types fall into six categories, including access management (AD/LDAP, Apache access, Okta), applications (GitHub, Google Workspace, Microsoft 365), cloud services (Azure), network activity (DNS, network, NetFlow), security (WAF) and system activity (Linux, Windows). Anything else, such as Kubernetes audit logs or OpenSearch's own audit log, becomes a custom log type. Picking a log type also preselects the matching rule set, and you can import or customize Sigma rules in OpenSearch Dashboards or through the API.
Field mapping is where the real work is. A Sigma rule refers to fields by name, so a detector needs to know which field in your index holds the source IP or the user name. If documents already carry ECS fields, Security Analytics maps them automatically, since ECS is its default mapping schema. Otherwise each field needs a manual mapping, and the documentation notes that more mapped fields means more accurate findings. This is the argument for normalizing in the pipeline: a field that is never mapped is a rule that never fires, and nothing tells you it didn't.
Once the mapping is in place, creating a detector is configuration. The following request creates a detector for Apache access logs that runs every five minutes and alerts on high and critical findings:
Loading code...
Rule IDs come from the search pre-packaged rules API, and the channel ID comes from the Notifications plugin. A trigger can fire on one rule or several, filter by severity and tags, and carry its own subject and body. Behind the scenes, the detector creates a composite monitor in the Alerting plugin. The enable_workflow_usage setting turns this on by default, so detector alerts route through the same Notifications channels as your other monitors.
Correlating across sources
The OpenSearch documentation is careful about what a finding means: it isolates an event of interest, but it doesn't necessarily mean a threat. Correlation exists to raise confidence. One failed login is noise, while the same account showing up in authentication logs and application logs within a few minutes is a story worth reading.
Consider a sequence adapted from the OpenSearch correlation blog. A user logs in to the VPN from a location they have never used. A few minutes later, the same account runs a privileged command on a Linux server. Shortly after that, the server opens an outbound connection to an address it has never contacted. Each event produces a finding from a different detector, and each one alone might be dismissed. Correlated, they read as one incident: a compromised account moving from access to privilege to exfiltration.
A correlation rule names two or more log types, each with an index and a query that selects the findings of interest. Findings that match within the rule's time window are correlated. A simpler rule in the same spirit pairs invalid-credential findings from Microsoft Entra ID sign-in logs with access-denied findings from an internal application, the pattern of someone trying a guessed account against an API that serves sensitive files:
Loading code...
ResultType 50126 is the Entra ID sign-in code for invalid credentials, and ad_ldap is the log type OpenSearch uses for those sign-in logs. The time_window field sets a 10-minute window for this rule, in milliseconds. Without it, the rule falls back to the plugins.security_analytics.correlation_time_window cluster setting, which defaults to 5 minutes. Setting the window per rule is the practical option on Aiven for OpenSearch, since that cluster setting is not one of the service's advanced parameters. A rule can also carry a trigger, so a correlation raises its own alert through Notifications.
The correlation graph in OpenSearch Dashboards shows the result. Each finding is a node, its border color shows its severity, and heavier lines between nodes mean a higher correlation score. That picture is often the most useful starting point, since it shows the order of events before anyone reads a log line.
Enriching with threat intelligence
Rules look for behavior. Threat intelligence looks for known-bad values: IP addresses, domains and file hashes that other organizations have already tied to attacks. Security Analytics stores these indicators of compromise (IOCs) in the same cluster as your events and scans for them on a schedule.
There are two parts to set up. A threat intelligence source supplies the IOCs. OpenSearch includes a default IP reputation feed from AlienVault, and a new Aiven for OpenSearch 3.8 service downloads it without any setup. A scan configuration then names the indexes or aliases to scan and the fields that hold each IOC type, such as source.ip and destination.ip for IPv4 addresses. It runs once a minute by default, checks newly ingested data, and creates findings and alerts through the same triggers and channels as detectors.
As an example, take a firewall that logs every allowed outbound connection to the security-network index. A scan configuration maps destination.ip to the IPv4 indicator type. When a workstation connects to an address on the reputation feed, OpenSearch records a finding against that document, and the trigger sends a high-severity alert to the security channel. The analyst opens the finding, pivots to the same host in Discover, and has the surrounding traffic in front of them without leaving the cluster. On a test Aiven for OpenSearch service, a document carrying an address from the default feed produced a finding less than a minute after it was indexed.
Watching the watcher: audit and compliance
Once authentication logs and firewall events live in OpenSearch, the cluster itself holds data an attacker would want to read or erase. It needs its own audit trail.
On Aiven for OpenSearch, audit logging is off by default and takes two steps to turn on. First, enable the enable_security_audit advanced parameter on the service. Then open the Security dashboard in OpenSearch Dashboards and turn on audit logging there. The logs land in daily auditlog-YYYY.MM.dd indexes on the same cluster, and they record events such as failed logins, missing privileges and attempts to modify the security configuration. Compliance settings in the same dashboard add tamper-evident logging. See Enable and manage OpenSearch audit logs in the Aiven documentation for the full steps.
Those audit indexes are one more log source. With a custom log type for the audit log, a detector can watch for repeated failed logins against the cluster or privilege errors from an unexpected user, so the SIEM watches the platform it runs on.
Auditing also covers the compliance side of a SIEM, which the OpenSearch blog's overview treats as a third pillar next to detection and investigation. An audit trail answers questions such as "who read the finance records in the last six months?" A monitor can alert on out-of-hours access to customer data, and index lifecycle policies hold events for as long as frameworks such as PCI DSS or HIPAA require. Post 5 will cover how to keep that history affordable.
Where OpenSearch stops
OpenSearch covers detection, correlation and investigation well, and it's worth being clear about where the edges are. Behavior baselining is partial: the Anomaly Detection plugin can flag patterns such as logins at unusual hours for a given user, but it is not a full user and entity behavior analytics product. Long history is searchable through searchable snapshots, though heavy analytics across a year of events may still fit ClickHouse® better, as post 1 argued. Response and case work stay in your SOAR or ticketing tool, with OpenSearch sending it the alerts.
Building a SIEM layer: configure, not build
Adding a SIEM layer to an existing log pipeline is mostly configuration. The collection, buffering and routing are already in place, so the new work is a security route through Kafka, field mappings that match a log type, and detectors, correlation rules and scan configurations on top. The part that deserves the most care is normalization, since every rule depends on it. Everything else is a request body or a few screens in OpenSearch Dashboards, and the security team gets a detection layer on the same platform the operations team already runs.
Next in the series: Hot/warm tiering, sizing and archiving. Start from the first post: Observability is a data problem
Try it: Start a 30-day free trial and create an Aiven for OpenSearch service on a paid plan, since the free tier doesn't include Security Analytics. Load a small sample of Apache access logs into a security-apache index, then create a detector for the Apache access log type in Security Analytics and enable a few prepackaged rules. After a few runs, open Findings to review the results. To look around without any setup, use the public OpenSearch Dashboards playground. Start free on Aiven
