


We're delighted to announce public preview for Kafka Connect support for Aiven for Apache Kafka. During preview, Kafka Connect is available at no extra cost as part of all Aiven for Apache Kafka Business and Premium plans. We're launching with support for OpenSearch connector, and will soon follow with S3 and other connectors.
Kafka Connect
Kafka Connect is a framework for linking Kafka with other services. It makes it simple to define and configure connectors to reliably and scalably stream data between different systems. Kafka Connect provides a standard API for integration, handles offset management and workload distribution automatically.
You can define and configure individual connectors via the Kafka Connect REST interface.
Case example - IoT Device Shadow
A customer of ours is using Aiven for Apache Kafka for capturing telemetry from a fleet of IoT devices. To that end, Aiven for Apache Kafka has proven to be a scalable and flexible pipeline for capturing and distributing traffic for processing.
During the past month, we've worked together to support a new use case: maintaining a "device shadow" or a latest state update in OpenSearch. This copy allows developers to query and access device states regardless whether the devices are currently online and connected or not.
We built this new pipeline together with Kafka Connect and OpenSearch Connector. You can follow these steps to set up a similar pipeline.
Getting started: Launching Kafka and OpenSearch services
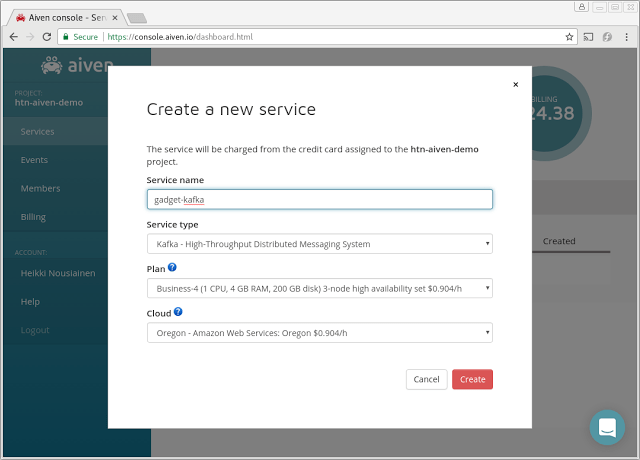
Create an Aiven for Apache Kafka service and create your topics for the incoming traffic. In this example, we'll be using Business-4 plan for the service and 16 partitions to accommodate for the client load.
First we'll launch a Kafka cluster from the Aiven Console. This cluster will receive the state updates from the IoT devices. A fairly low-spec cluster will work for this use case and we will launch it in one of the AWS regions:
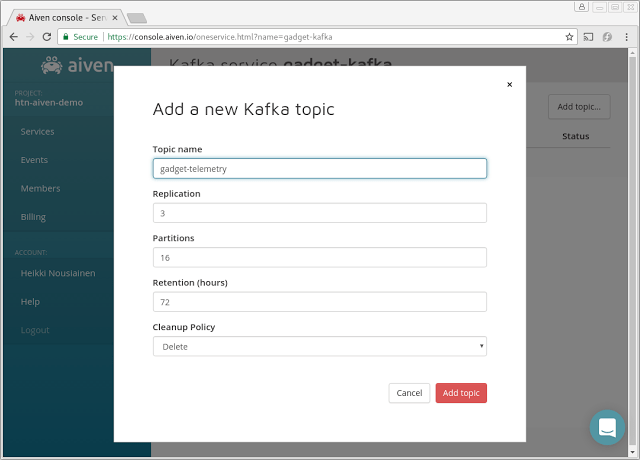
Next, we'll create a Kafka topic for our data under the Topics tab.
We chose 16 partitions in this example, but you should select a number that matches with your workload. A larger number allows for higher throughput to support, but on the other hand increases resource usage on both the cluster as well as the consumer side. Contact us if unsure, we can help you to find a suitable plan.
We will also need an OpenSearch cluster for the device shadow data. We'll choose a three-node cluster with 4 GB memory in each node. Make note of the OpenSearch Service URL, which we'll use with the Kafka Connector configuration in the next steps.

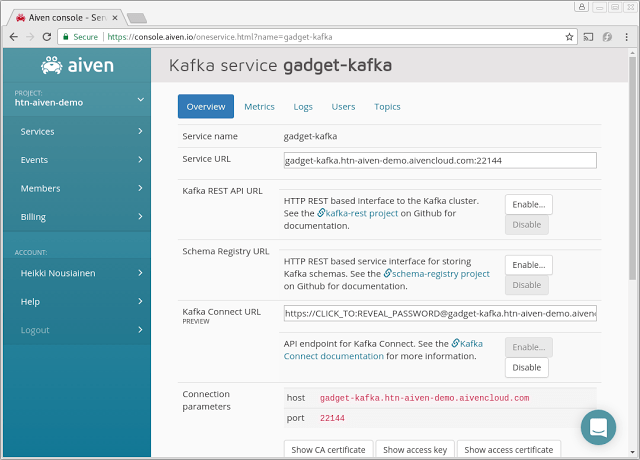
We'll need to enable Kafka Connect by clicking the "Enable" button next to it in the service view. We also make a note of Kafka Connect access URL, which we will need in the following steps.
Setting up the pipeline with scripts
We'll be using a couple of Python code snippets to configure our data pipeline. We've downloaded the project and Kafka access certificates as ca.pem, service.cert and service.key to a local directory from the Kafka service view.
You can refer to startup guides for both Aiven Kafka and Aiven OpenSearch for details on setting up the environment.
Here's our first snippet named query_connector_plugins.py for finding out the available connector plugins:
Loading code...
By running the script we can find out the available connector plugins:
Loading code...
To get started with the pipeline configuration, we'll pre-create an OpenSearch index with a schema to meet our needs with script name create_elastic_index.py:
Loading code...
Next, we'll run the script and the Elasticsearch index is created:
Loading code...
Here's how we create and configure the actual Elasticsearch Connector to link our telemetry topic and Elasticsearch with a script named create_es_connector.py:
Loading code...
And enable the Connector by running the script:
Loading code...
Next, we're going to send some simulated telemetry data to test everything out:
Loading code...
Now we execute the script:
Loading code...
Exploring the data with OpenSearch dashboards
All of our Elasticsearch plans include integrated Kibana, which can be a handy tool for exploring and/or visualizing the data too. We can easily verify that our telemetry is flowing all the way to our Elasticsearch instance.
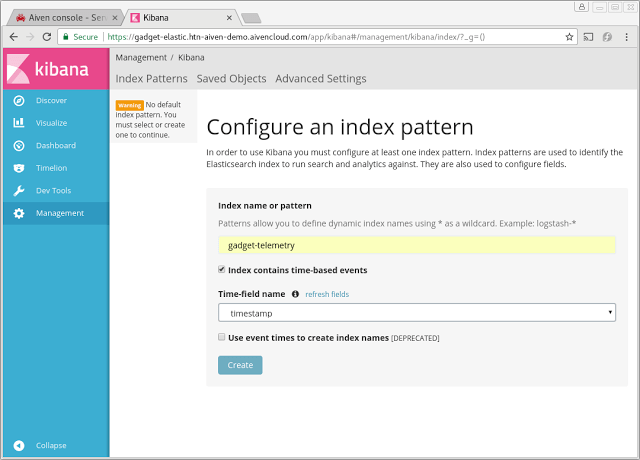
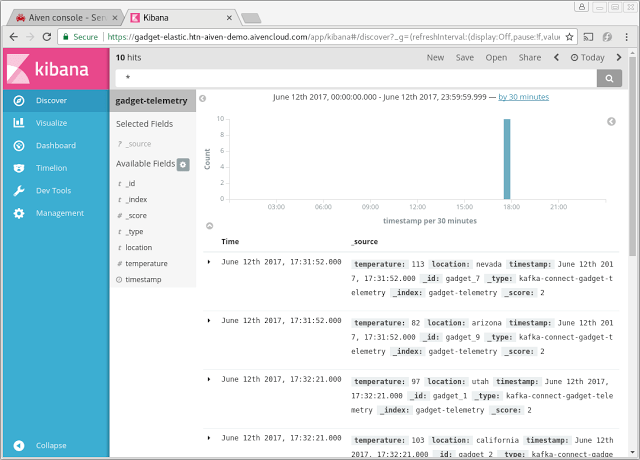
Clicking the Kibana link under the Elasticsearch service information page opens a view to OpenSearch dashboards. We are greeted with a configuration page where we enter the name of our Elasticsearch index created in one of the earlier steps:
Default discovery view on our sample data. The default view lists our entries. Since we're using keyed messages and the entry is always replaced with the latest entry, the timeline view will show only the timestamp of the last reception.
Accessing data in Elasticsearch
The real value of the new pipeline is realized with the ability to query for device information from Elasticsearch. In the Elasticsearch example query script (query_elasticsearch.py) below, we'll query for all devices that last reported from Arizona:
Loading code...
Loading code...
Running the script show the list of active gadgets in the target region:
Loading code...
Loading code...
The above example is easily extended to query data by a certain temperature threshold, location or time of the last update. Or, if we want to check the state of a single device, we now have the latest state available by its ID.
Summary
In this example, we built a simple telemetry pipeline with Kafka, Kafka Connect and Elasticsearch. We used Elasticsearch connector, which is the first connector we support with Aiven Kafka. We'll be following up with S3 connector shortly with others to follow.
Get in touch if we could help you with your business requirement!
Give Aiven services a whirl
Remember that trying Aiven is free: you will receive US$10 worth of free credits at sign-up which you can use to try any of our service plans. The offer works for all of our services: PostgreSQL, Redis, Grafana, Elasticsearch and Kafka!
Go to aiven.io to get started!
